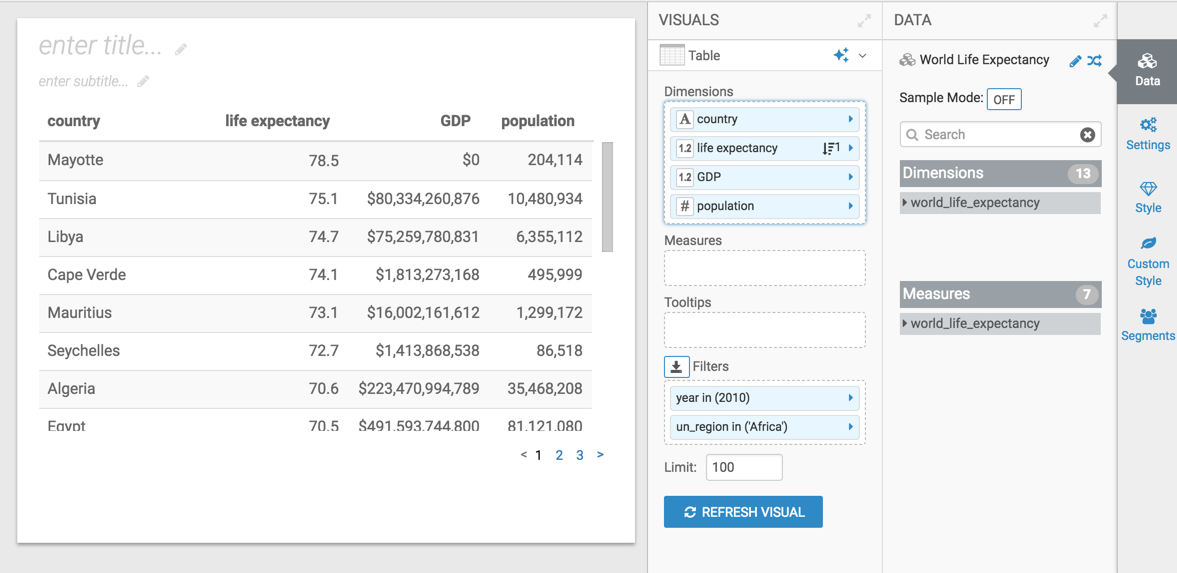
In the Visuals menu, select the
Table visual type.
Populate the shelves of the visual from the fields listed in the Data
menu:
Dimensions
Add the fields country,
life_expectancy,
gdp_per_capita, and
population.
Filters
Add the field year, and select
the value 2010.
Add the field
un_subregion, and set it to
Africa.
Specify descending order on life_expectancy.
Optional: In the Enter/Edit Expression editor, change the
gdp_per_capita calculation on the shelf, and rename
it:[gdp_per_capita]*[population] as 'GDP'
Optional: Change the Display Format options for the fields on the
shelves to remove extra decimals, specify currency, and so on.
Optional: Change the Alias for the fields on the shelves. Click
Refresh Visual to update the table visual.