
Adding filters to a visual
Cloudera Data Visualization enables you to add filters to a visual if the visual has a Filters shelf available.
-
Populate the Filters shelf from the available fields
(Dimensions, Measures) in the
DATA menu.
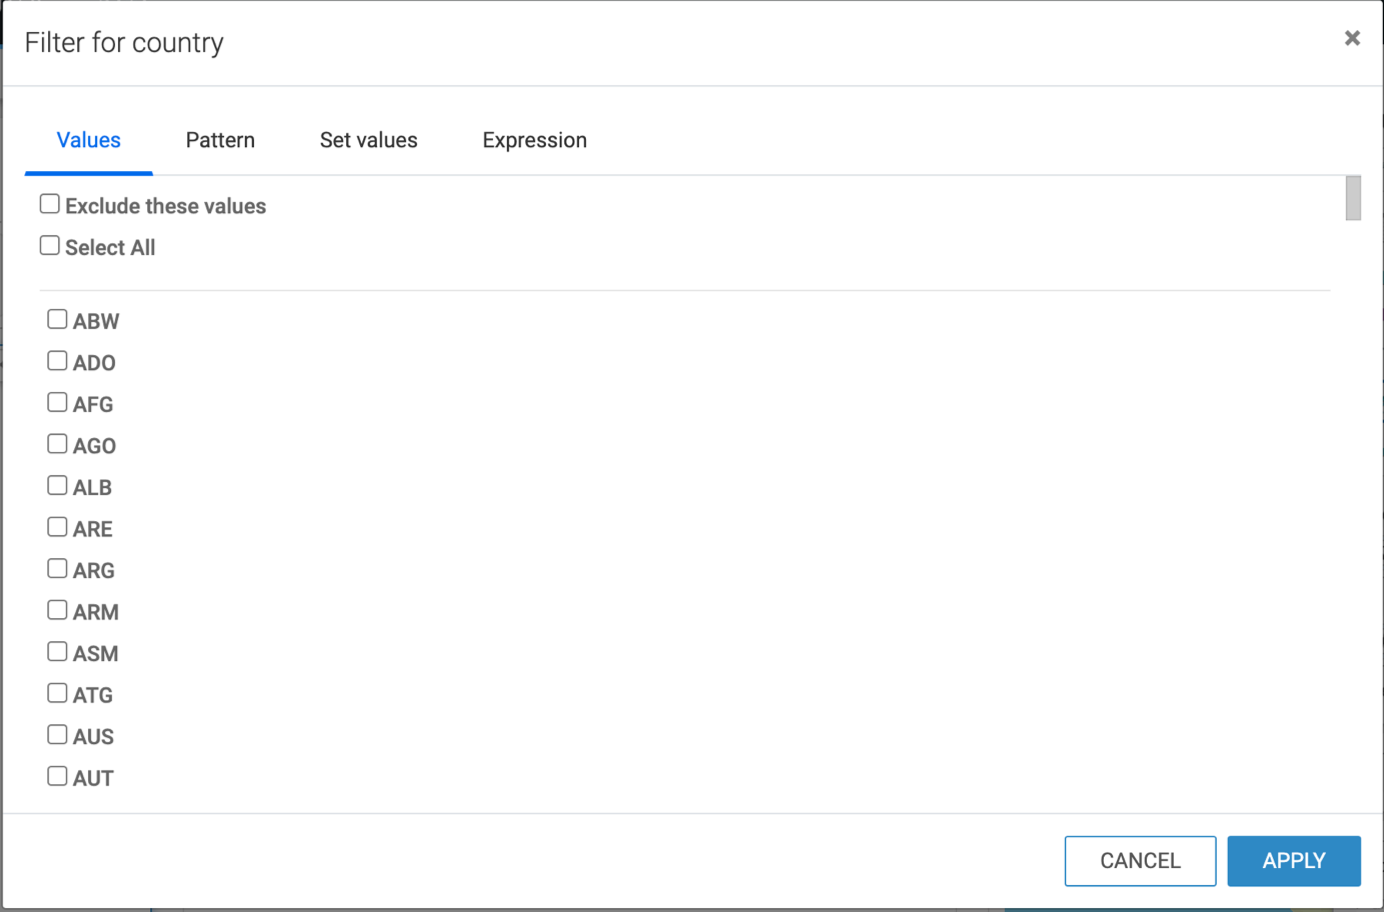
In this example, the country field is added to the filter shelf. A modal window pops up where you can set the values you want to filter for. You can choose discrete values, ranges, patterns, or use the Select All option for a bulk selection of the shown filter values.
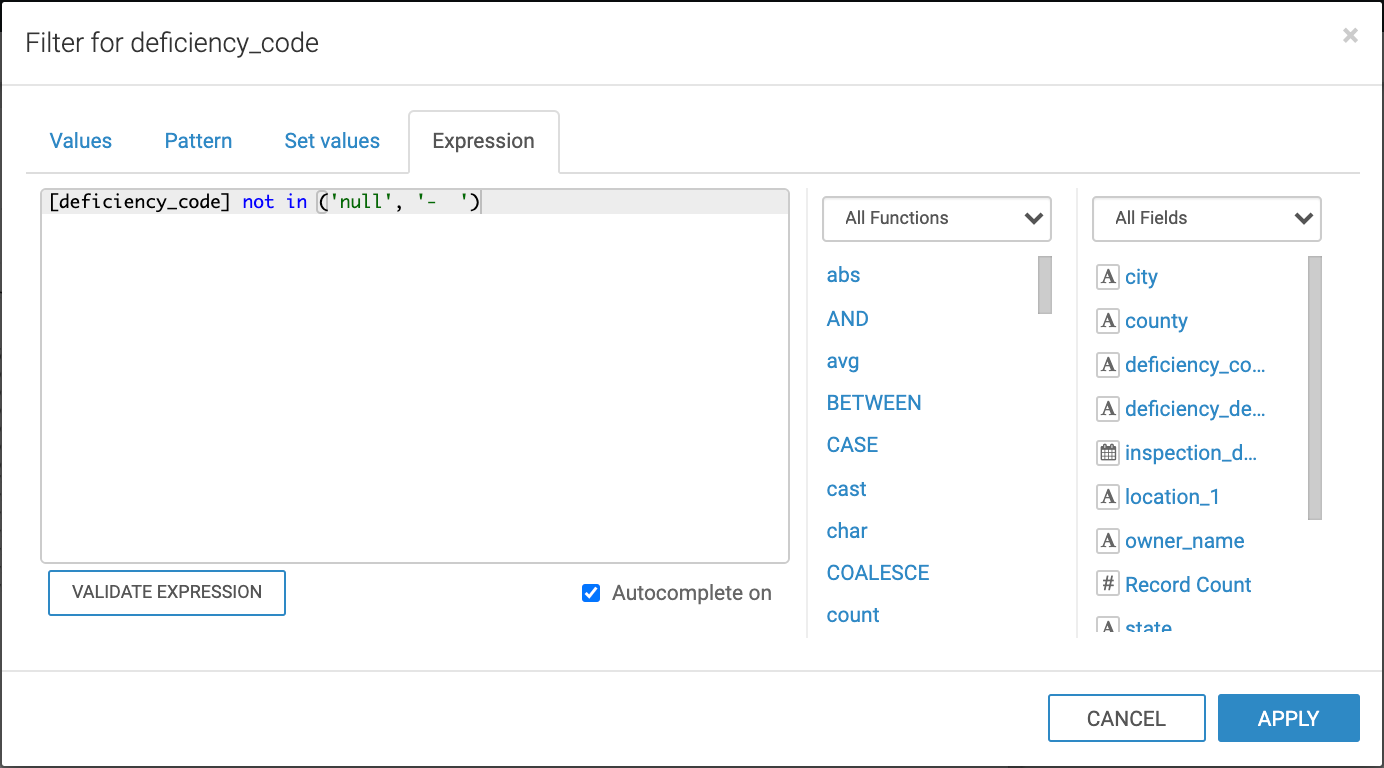
You can also create your own custom filter expressions by using the Expression tab. In this example, the deficiency_code field is added to the filter shelf with a custom filter expression.
You can use the filter with its default settings, or you can open the Settings menu from the side menu bar to configure your filter.
