Creating visuals with optional dimensions
-
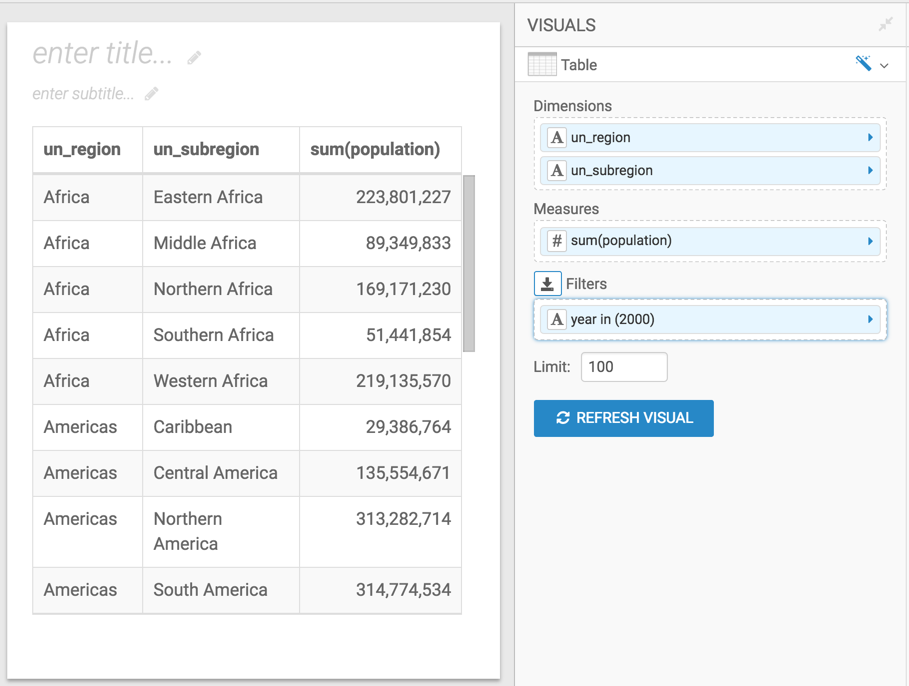
Populate the shelves of the visual:
- From Dimension, select and move
un_regionandun_subregionfields onto the Dimension shelf. - From Measures, select and move
populationfield onto the Measures shelf. - From Dimensions, select and move
yearfield onto the Filters shelf. - On the Filters shelf, select
yearfield, choose Pick values from a list, select2000, and click SAVE.
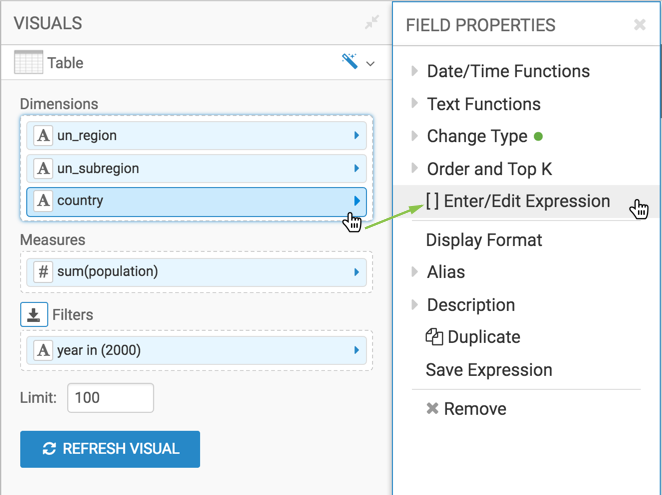
- From Dimension, select and move
-
In the FIELD PROPERTIES menu, select [ ] Enter/Edit
Expression.
-
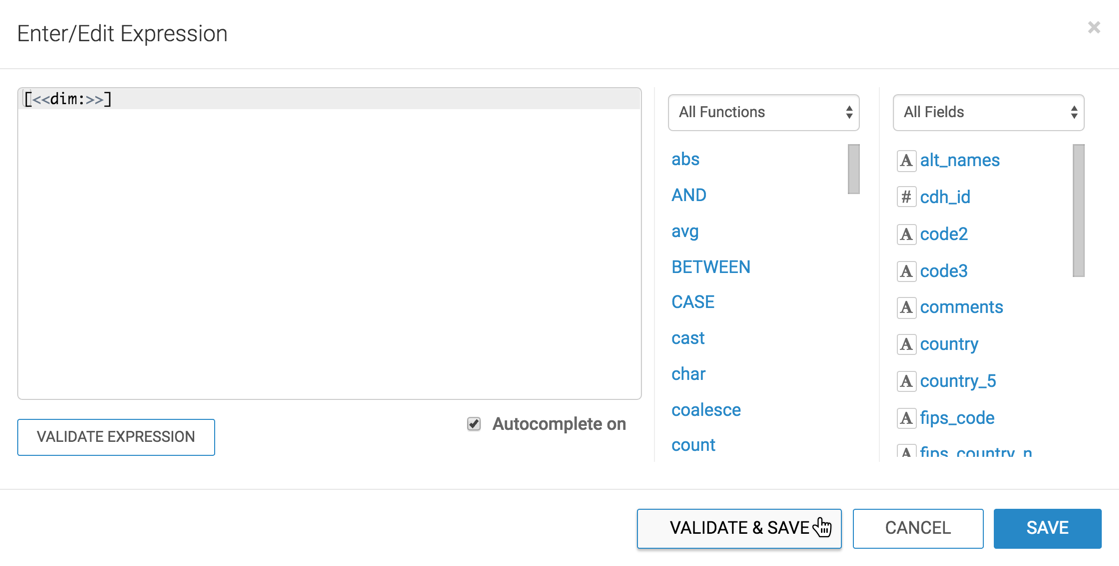
In the Enter/Edit Expression modal window, change the text to
the following expression:
[<<dim:>>]