
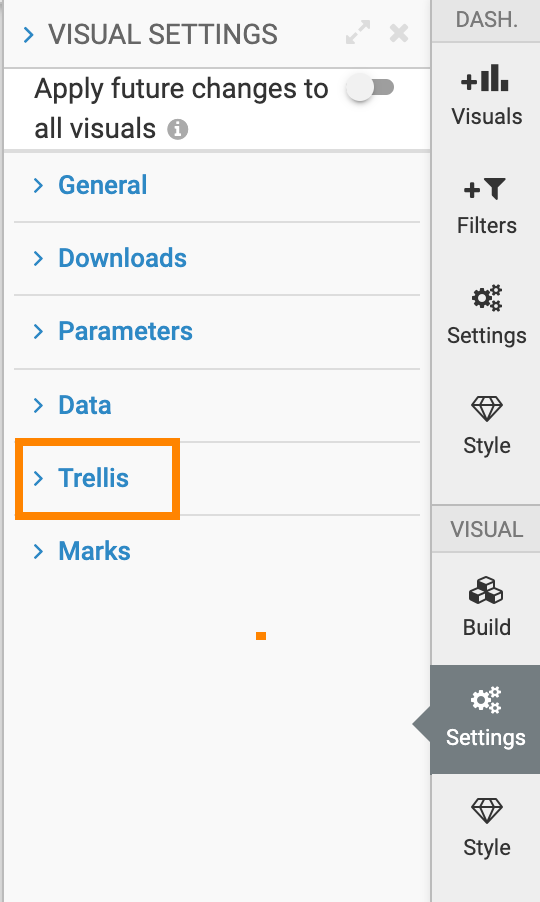
Enabling independent axis scale
- In the Settings menu, click
Trellis.
-
To enable independent axis scale, select the relevant option.
Depending on the type of visual, this option may appear as one of:
- Independent Dimension Scale
-
For Bar, Lines, Areas, Grouped Bars, and Box Plot visuals, to make dimension scale independent, navigate to the Trellis menu, and select Independent Dimension Scale.

- Independent Measure Scale
-
For Box Plot visual, to make the measure scale independent, navigate to the Trellis menu, and select Independent Measure Scale.

- Independent Aggregate Scale
-
For Bar, Lines, Areas, and Grouped Bars visuals, to make the aggregate scale independent, navigate to the Trellis menu, and select Independent Aggregate Scale.

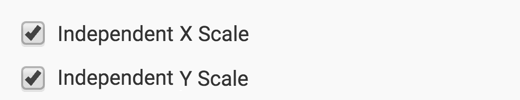
- Independent X Scale
- Independent Y Scale
-
For Scatter and Histogram visuals, to make the X and/or Y scales independent, navigate to the Trellis menu, and select Independent X Scale and/or Independent Y Scale.
- Scale independently across trellis
-
For Gauge and Bullet visuals, to scale independently across trellis, navigate to the Trellis menu, and select Scale independently across trellis.

- Independent scales
-
For Map visual, to scale independently across trellis, navigate to the Trellis menu, and select Independent scales.

- Independent date scale
-
For Calendar Heatmap visual, to make the date scale independent, navigate to the Trellis menu, and select Independent date scale.

To learn how to make scales independent, see Trellis option with independent scale.
