
Cloudera Data Visualization, Data interface
The information and functionalities available on the DATA interface of Cloudera Data Visualization enable you to manage the data you need for your visualizations and to initiate a number of operations when working with datasets and data extracts.
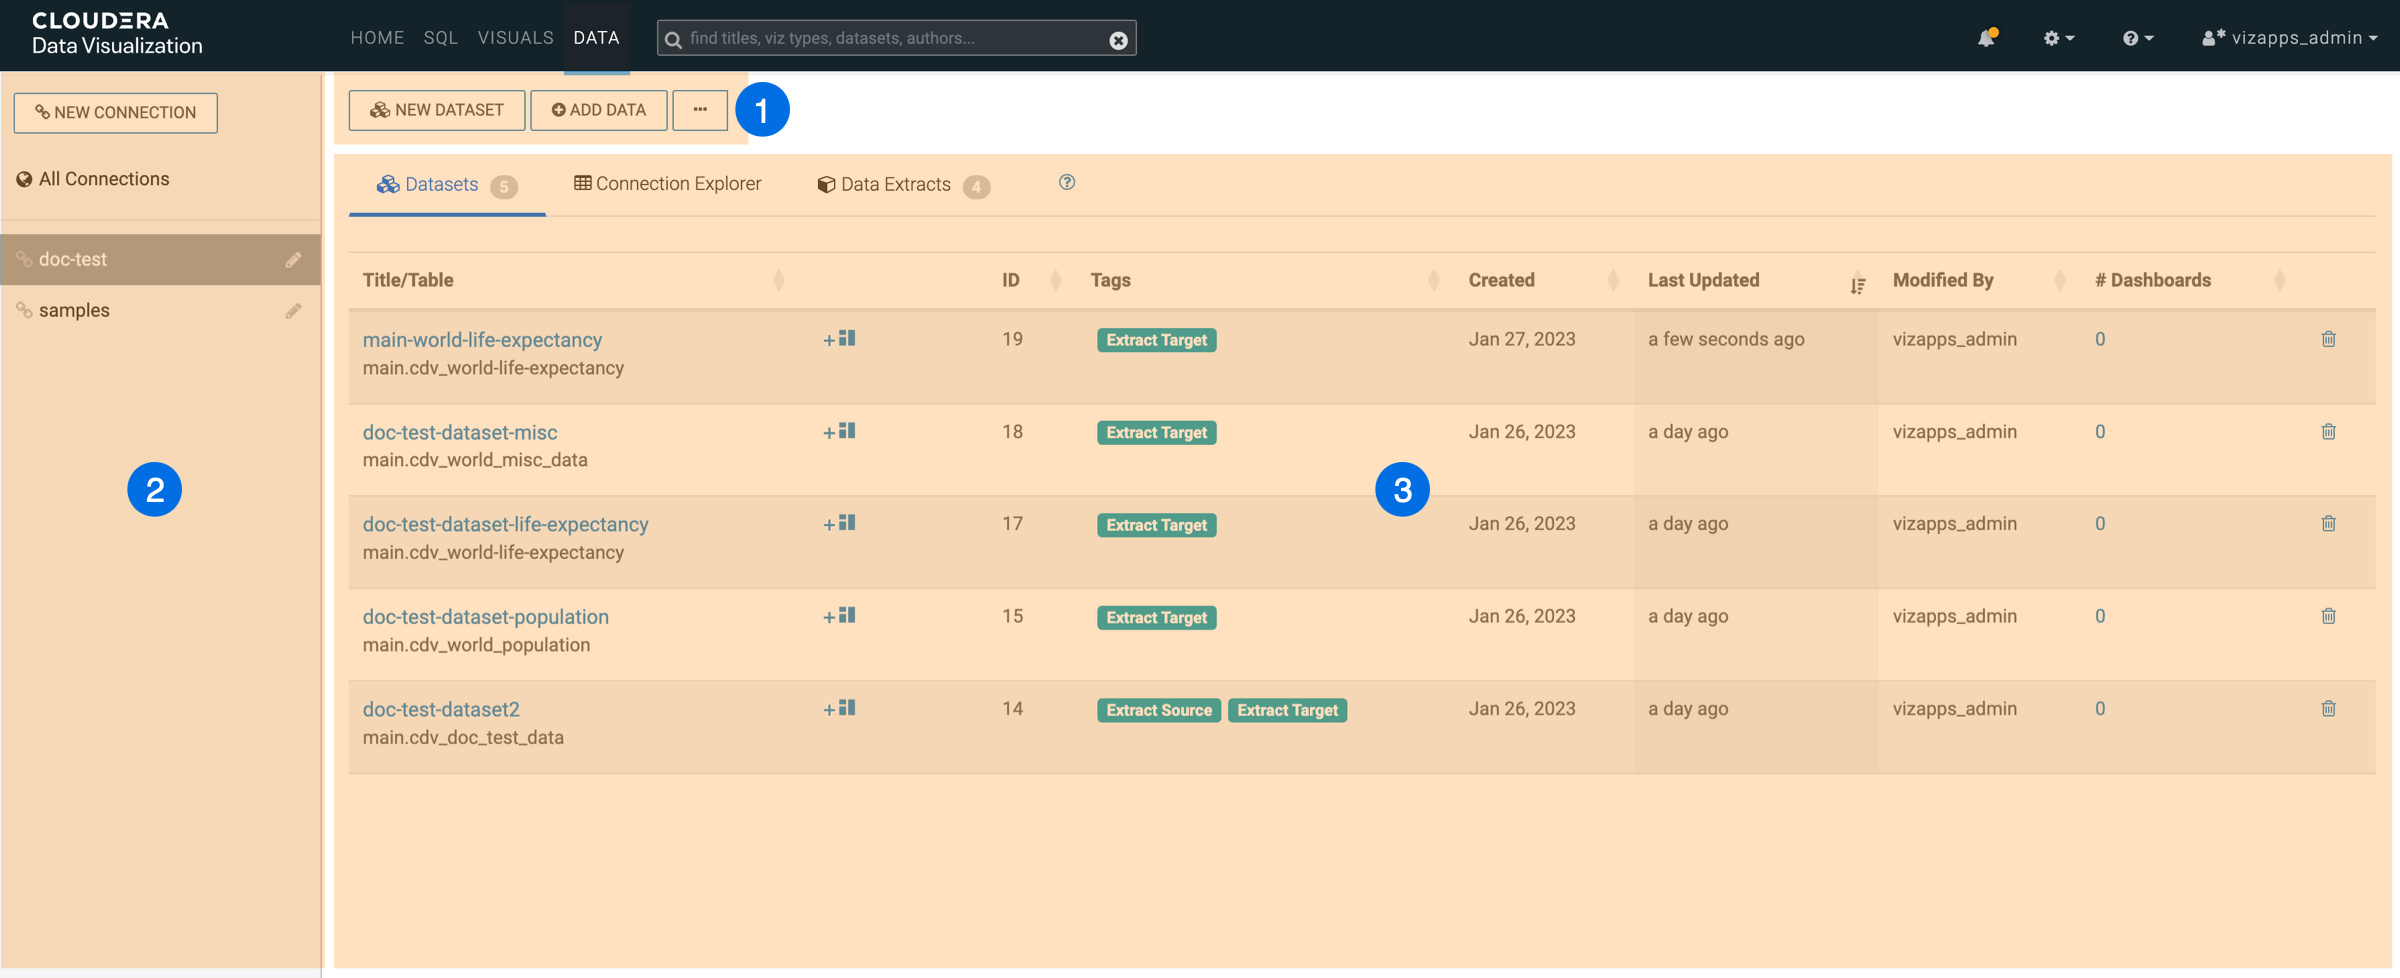
- DATA interface top menu bar
- DATA interface side menu
- DATA interface preview area
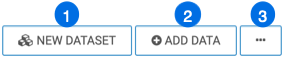
DATA top menu bar
-
The NEW DATASET button is for creating datasets. Datasets are needed for developing dashboards and visuals. You can also start a new dataset from a specified table.
-
For SQLite connections, the ADD DATA button enables you to introduce data from outside sources to enrich your datasets.
-
The Supplemental menu provides access to additional functions:
- Clear result cache forces a reload of the full table definition.
- Import Visual Artifacts enables you to restore or import visual artifacts from a backup JSON file.
- Direct Access lets you access data on the connections directly and build datasets from specific SQL queries, as opposed to starting with an existing table.
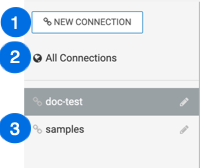
DATA side menu
-
The NEW CONNECTION button is for connecting to a new data source.
-
You can list all your datasets by clicking All Connections.
-
samples is a SQLite connection in Cloudera Data Visualization that contains example datasets. This connection is read-only by design, so sample datasets cannot be modified.
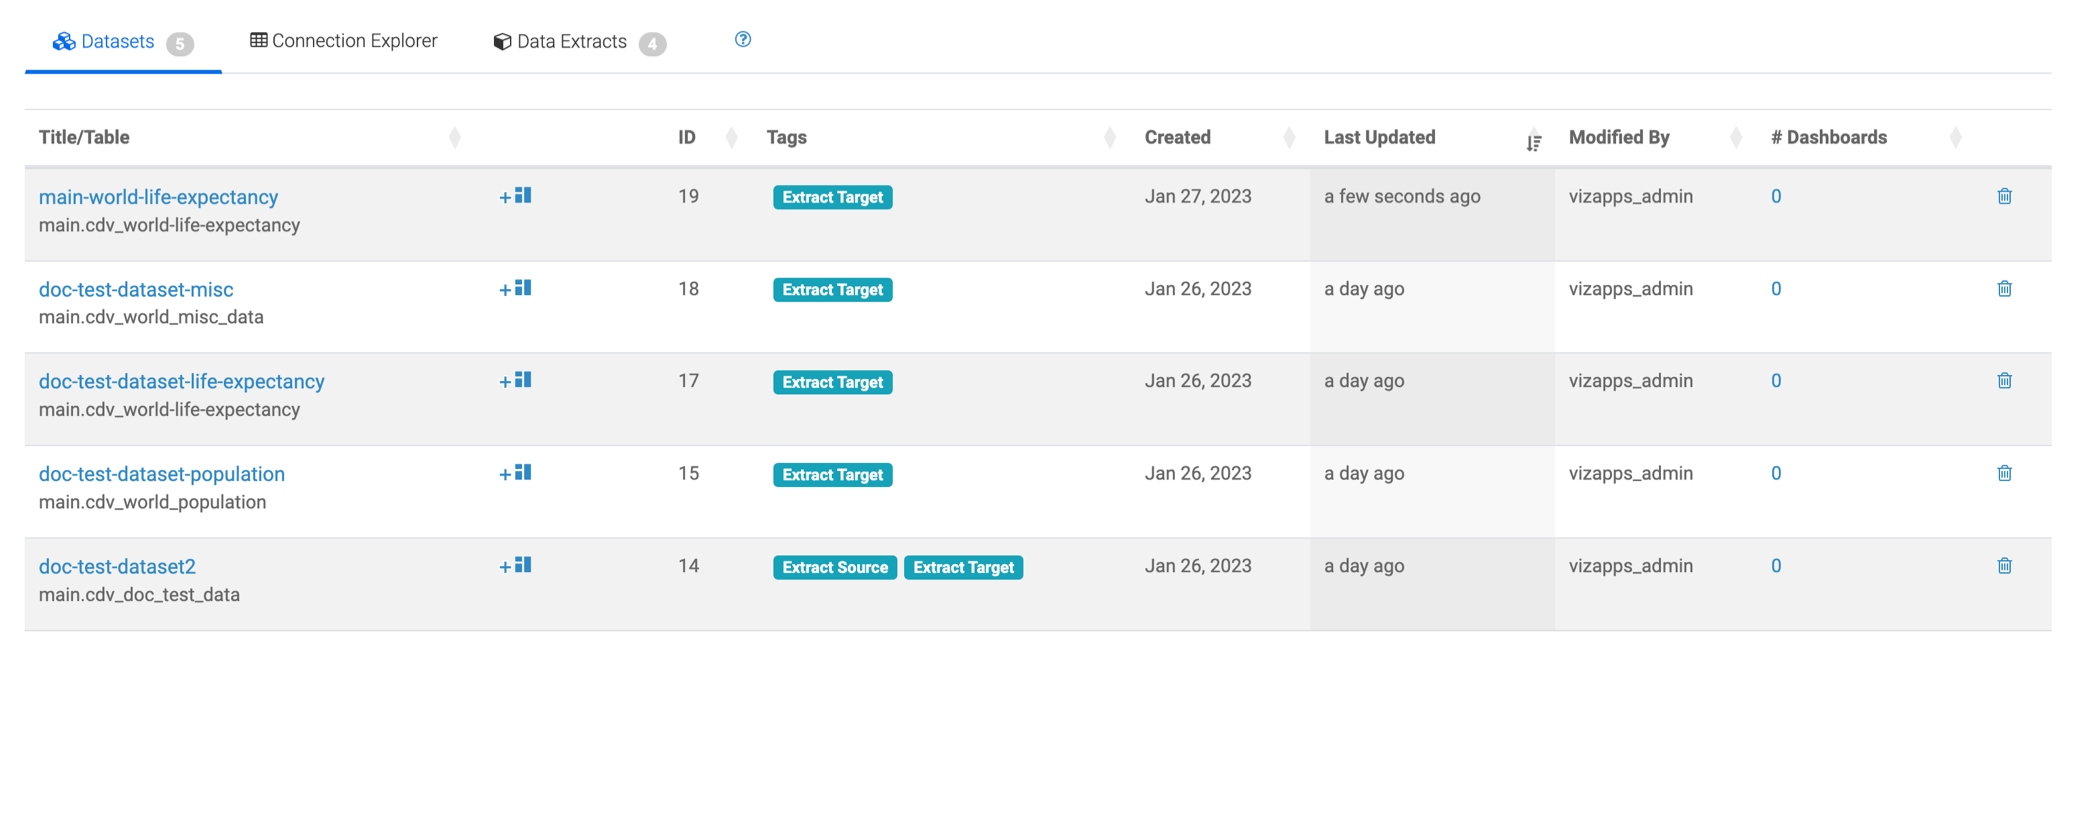
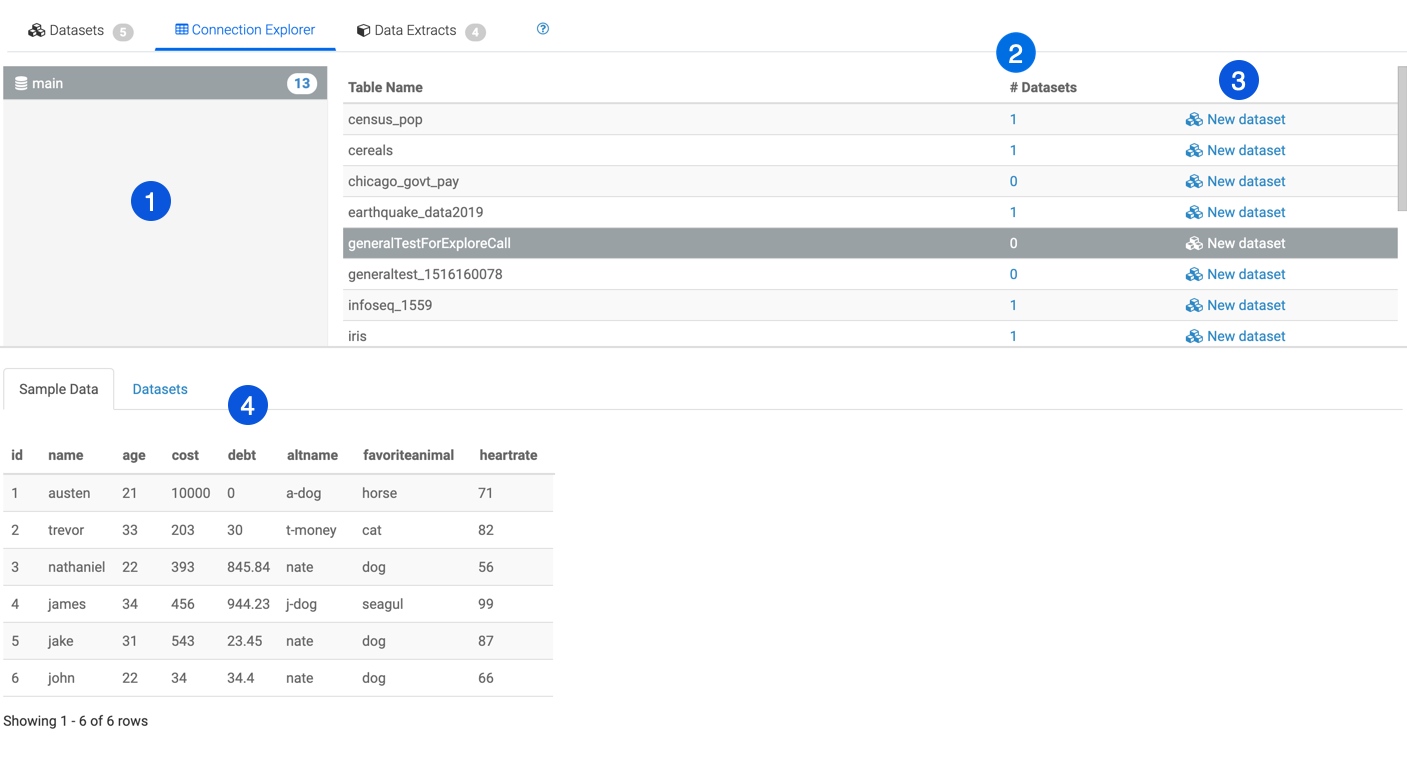
DATA preview area
The data preview area has three tabs: Datasets, Connection Explorer, and Data Extracts.
-
The database area shows all databases that you can access through the current connection. Selecting a database displays its tables.
-
The Datasets column lists the number of datasets that use the particular table as their initial definition.
-
You can click the New dataset link to create a dataset on a specific table.
-
To see more information about data tables, you can click the row of each table. The additional information is displayed under two tabs: Sample Data and Datasets.
-
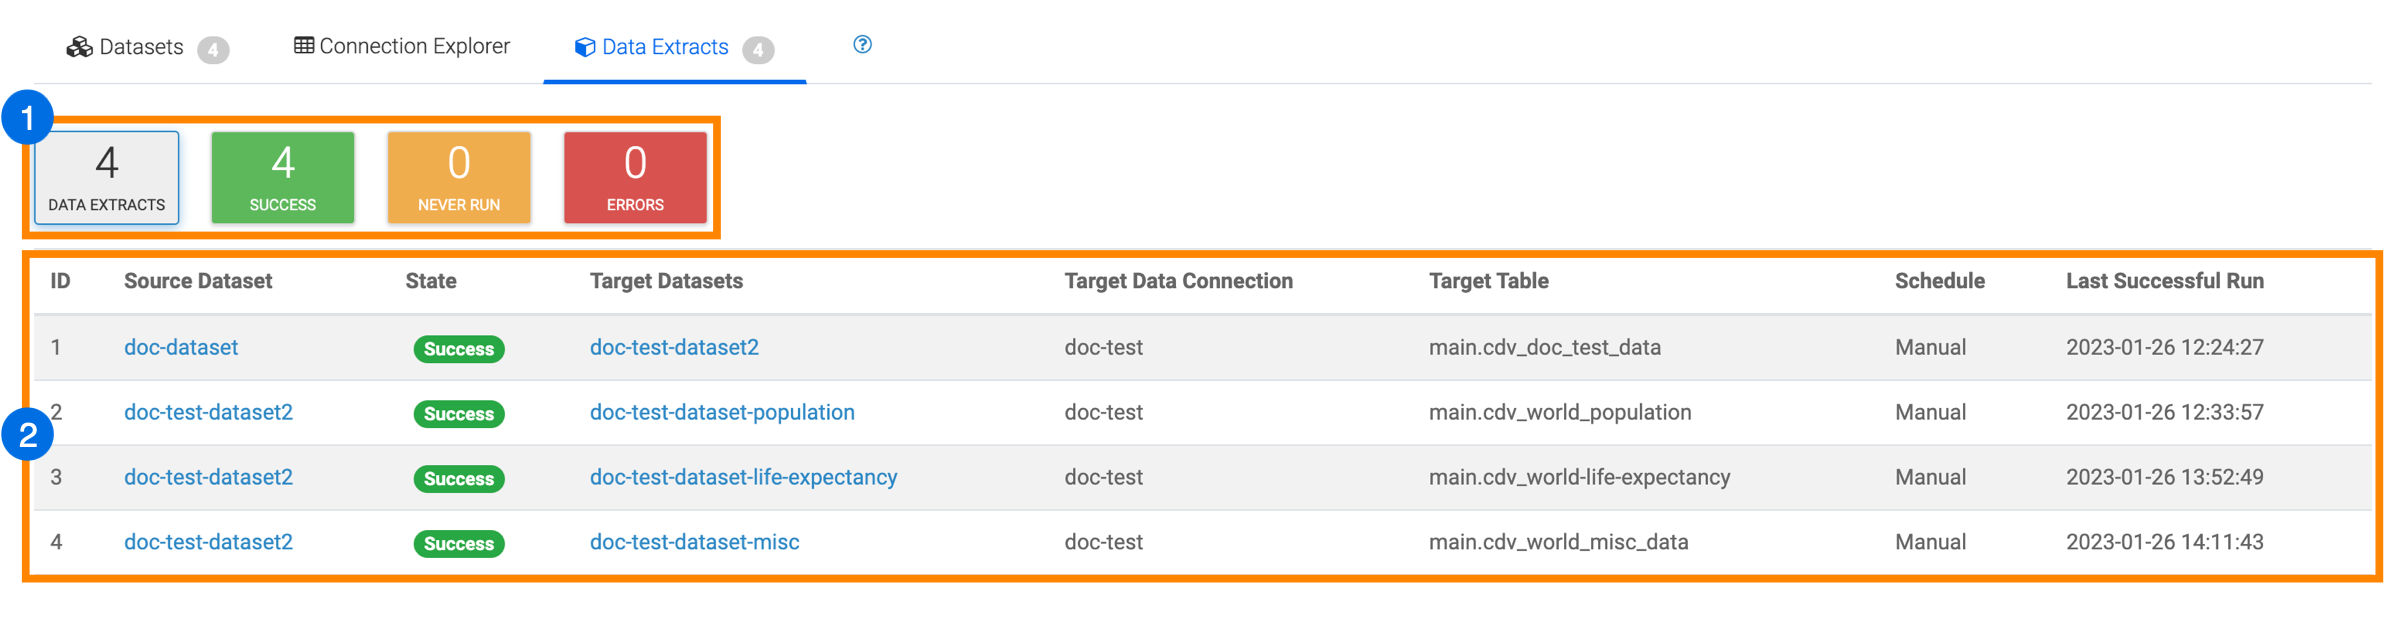
Overall statistics
-
List of Data Extracts sourced from the current data connection
