Refreshing visuals manually in dashboards

Cloudera Data Visualization enables you to manually refresh visuals in dashboards.

If you have a slow back-end data connection and your dashboard is loading slowly, you can choose to load the filters first, specify their settings, and then manually load the visuals.

  1. Open the dashboard in Edit mode.
    In this example, the World Life Expectancy dashboard is used.
  2. In the Dashboard Designer, select the Settings menu.
  3. Click the General menu to expand it.
  4. Select the Refresh visuals manually option.
    This adds a REFRESH VISUALS button to the dashboard.
  5. Under Filters, click the year field to add a new filter widget to the dashboard and select 1900 from the dropdown.
  6. Click SAVE.
  7. Switch to View mode.
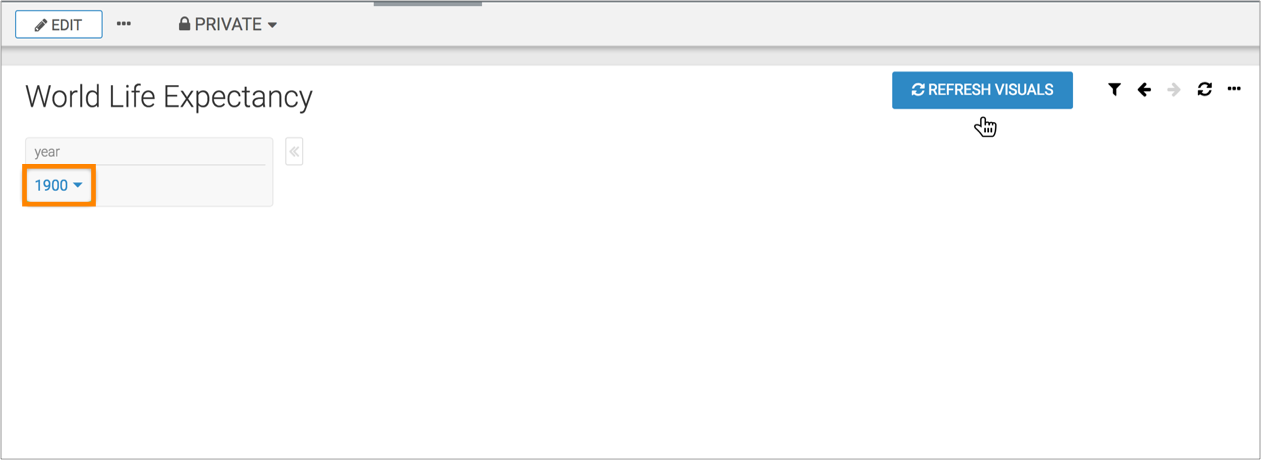
    Only the filter widget appears on the dashboard without any visuals.
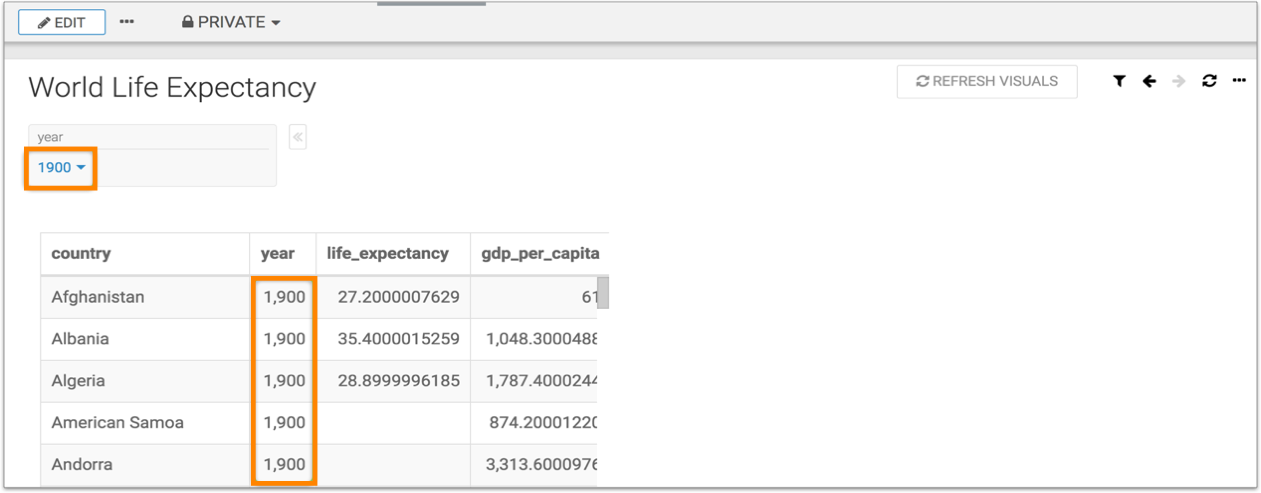
  8. To view visuals, click REFRESH VISUALS in the top right corner of the dashboard.

    The visual now appears in the dashboard along with the defined filter.

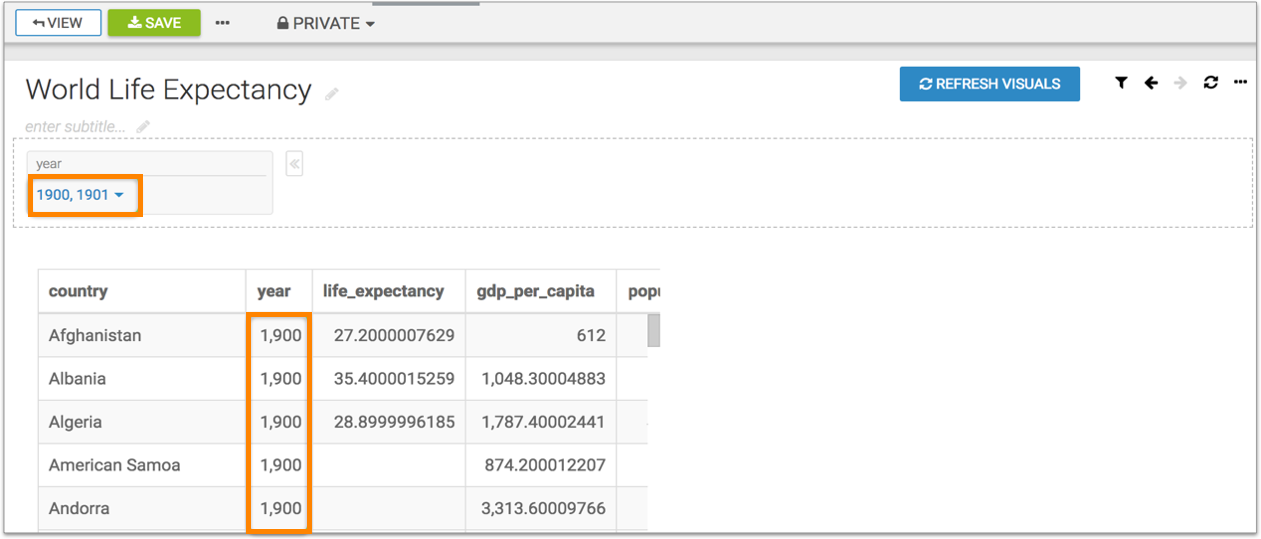
  9. Add the year 1901 to the filter.
    As soon as you change the filter, the filter refreshes to show both the values 1900, 1901, but the visual does not refresh. The year column continues to show only 1900. Also, the REFRESH VISUALS button again appears in the top right corner of the dashboard.
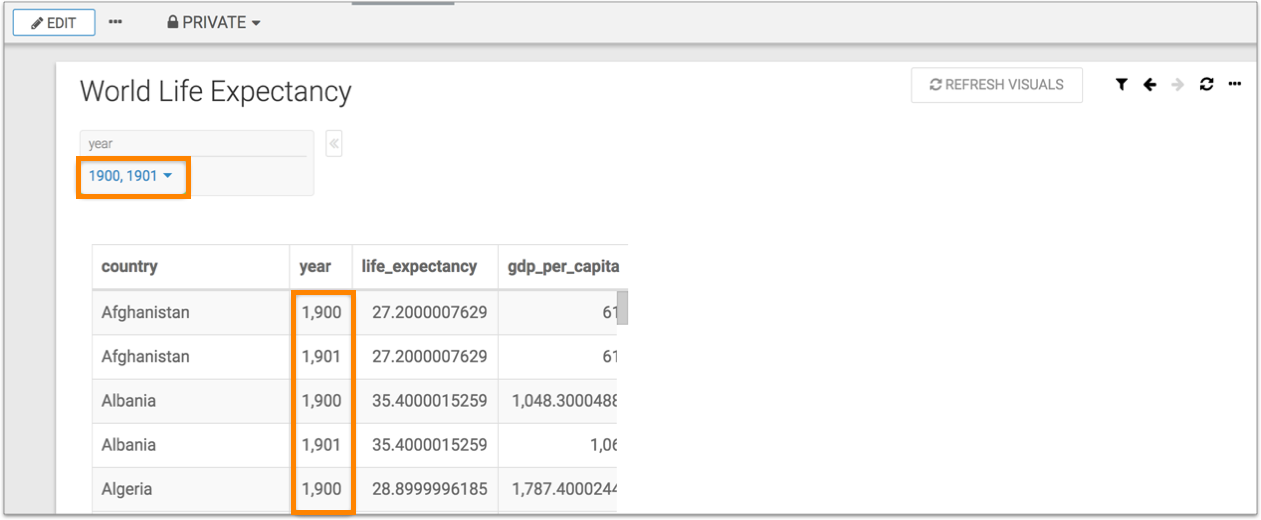
  10. To render the updated visual, click REFRESH VISUALS.
    The year column now shows the updated values, 1900 and 1901.
  11. Click SAVE.