Cloudera Data Visualization allows you to create Row Listing visuals. Row
Listing is useful when you want to display raw data in a structured format.
The following steps demonstrate how to create a Row Listing
visual based on the Cereals dataset. For an overview of the shelves that specify this
visual, see Shelves for row listing.
Start a new visual based on the Cereals dataset.
By default, a table visual is displayed that shows all fields in the dataset.
For
instructions, see Creating a visual.
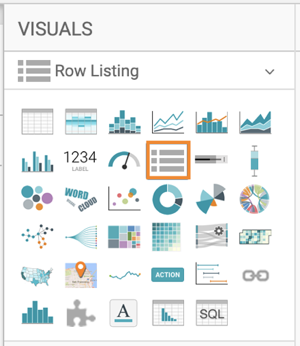
In the VISUALS menu, find and click the Row
Listing icon.
The shelves of the visual change.
Populate the shelves from the available fields (Dimensions and
Measures) in the DATA menu.
Make the following selections to recreate the example Row Listing visual:
Under Dimensions, select ‘cereal_name’ and ‘manufacturer’ and
add them to the Dimensions shelf.
Under Measures, select ‘calories’ and add it to the
Measures shelf.
For further information about the shelves of the visual, see Shelves for row
listing.
Click REFRESH VISUAL.
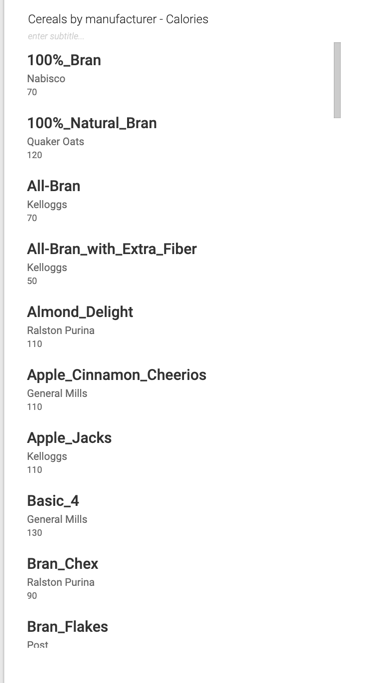
The updated Row Listing visual appears.
At the top left corner of the Visual Builder, click SAVE.
In this example, you can see a list of different cereals together with their manufacturer
and calorie information.