Creating a visual
You can easily create new visual representations for your data in Cloudera Data Visualization.
-
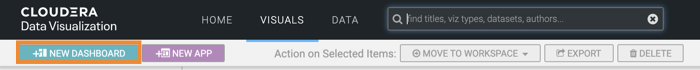
Click to open a new, blank dashboard.
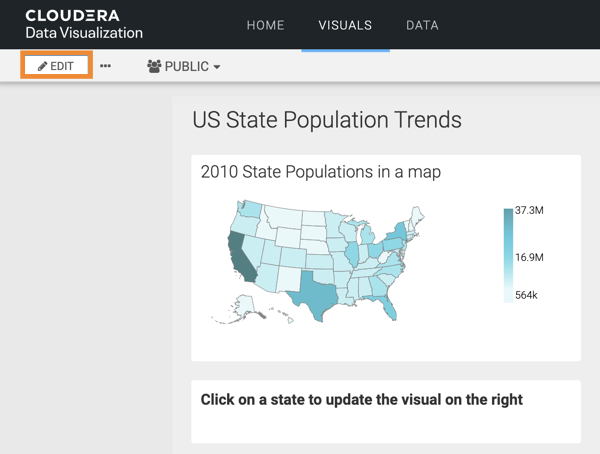
If you already have an existing dashboard and you just want to add a new visual, open the dashboard and click EDIT to make changes to it.
-
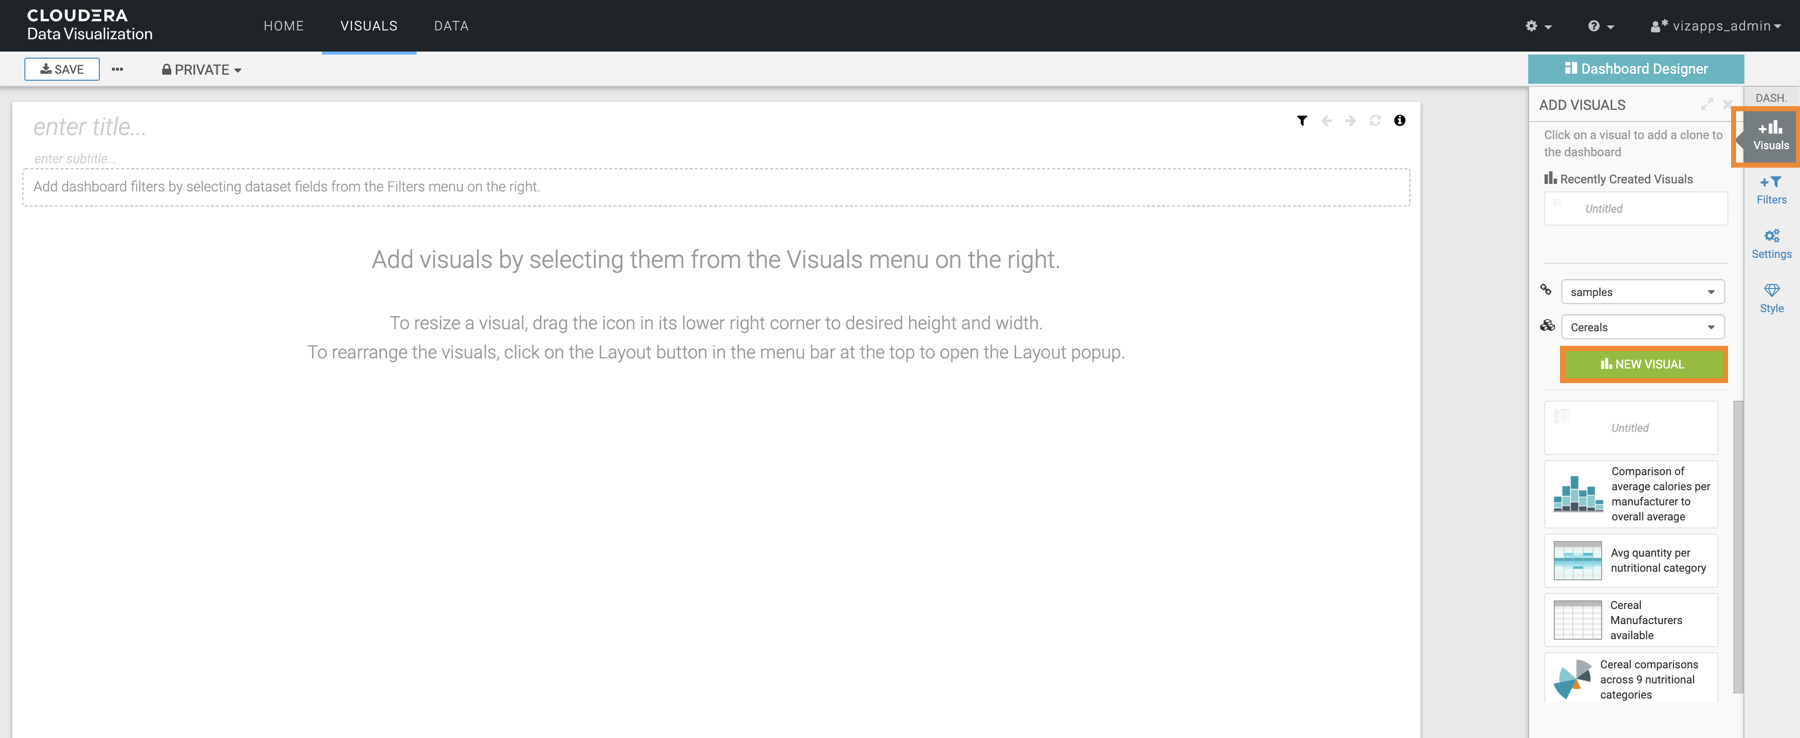
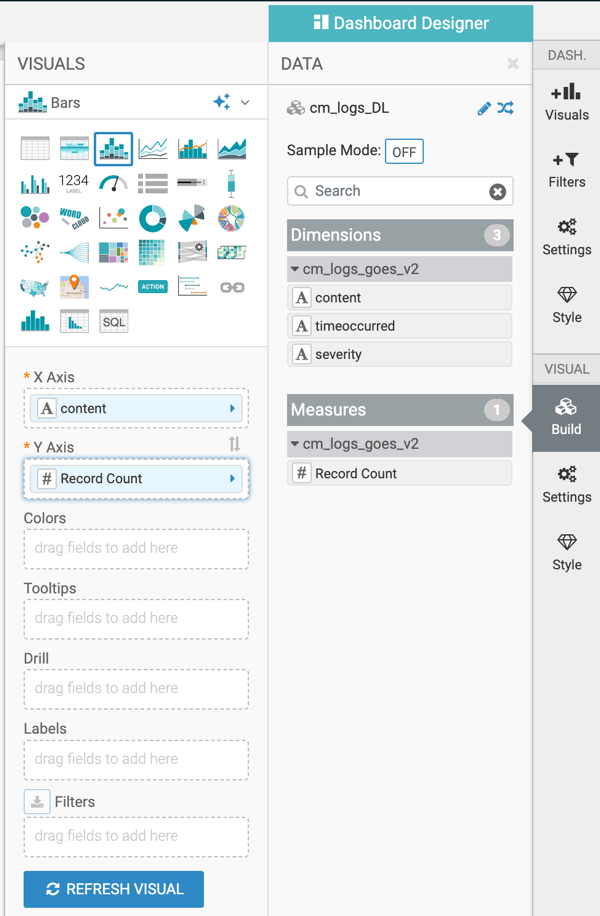
In the Dashboard Designer interface, open the
Visuals menu from the side menu bar and click NEW
VISUAL.
-
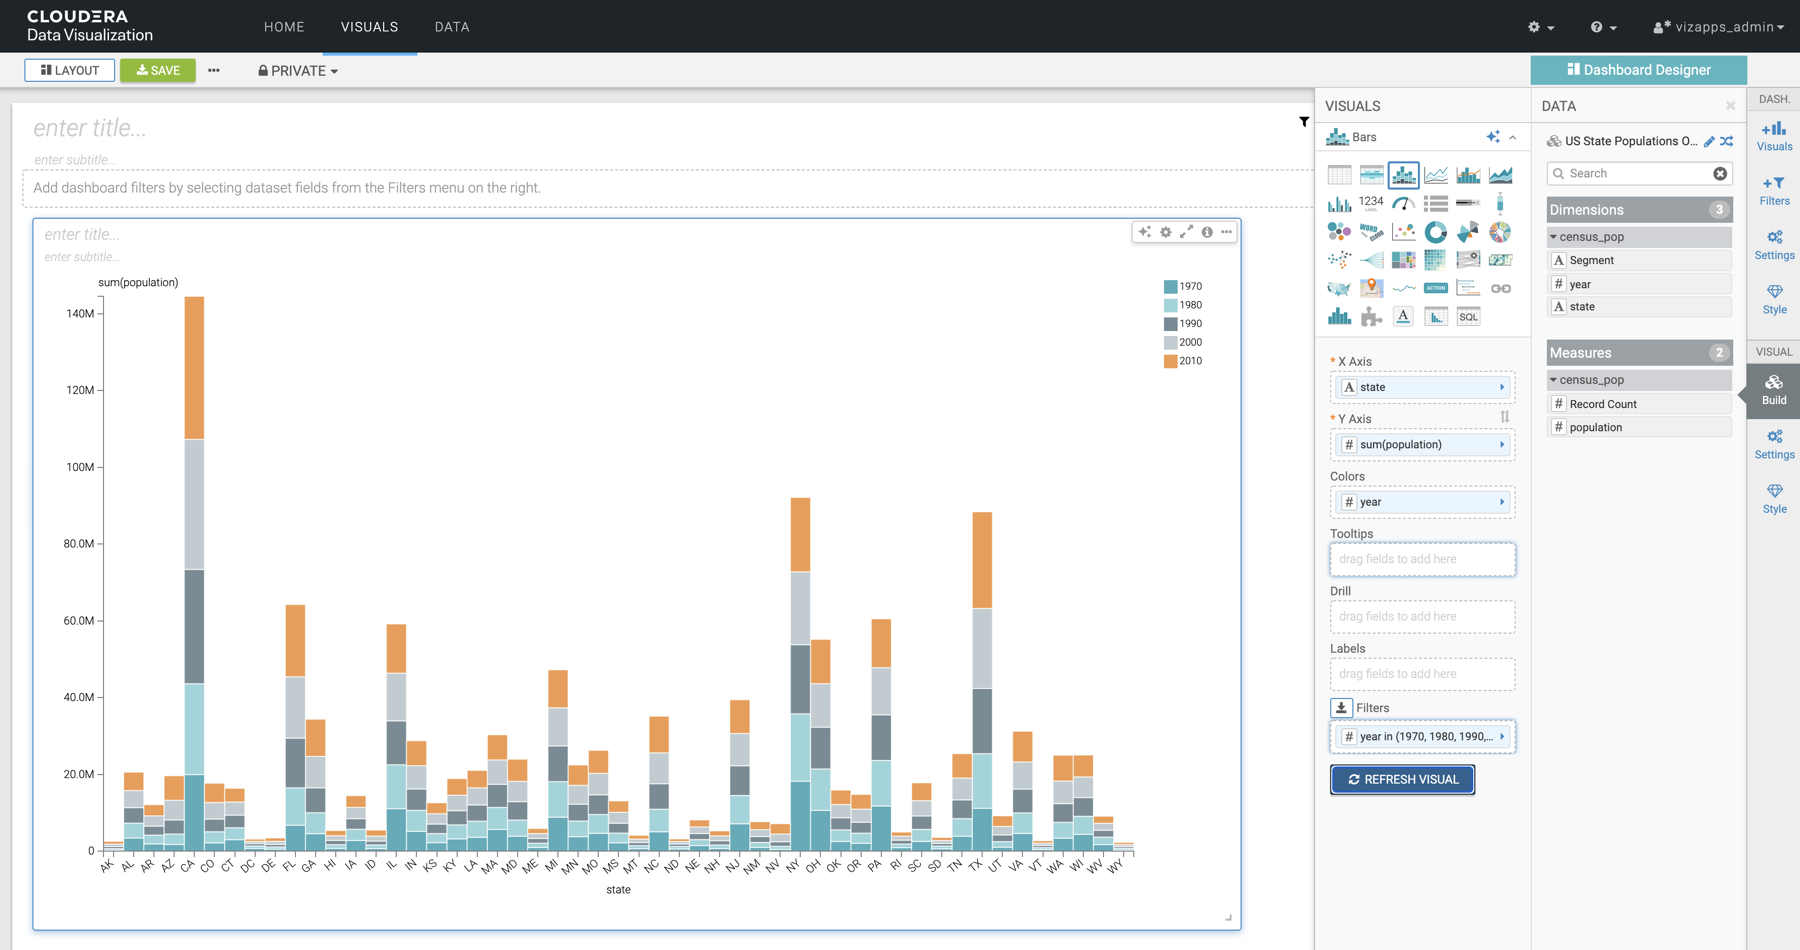
Choose the visual type you want to build.
In this example, the Bars visual has been selected.
- Optional:
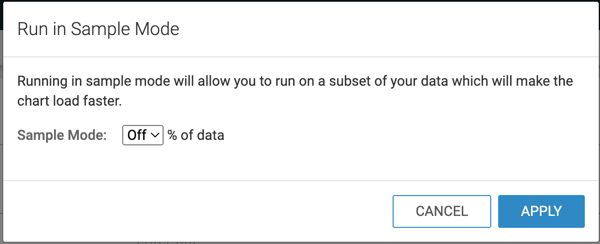
You can switch on Sample Mode for the visual you are
building.
With sample mode, you create the visual on a subset of your data to test it. You can define this subset as a percentage of the original data.
-
Click REFRESH VISUAL.