Difference from next value analytic function
This article describes how to use the Difference from Next Value analytic function in Cloudera Data Visualization.
-
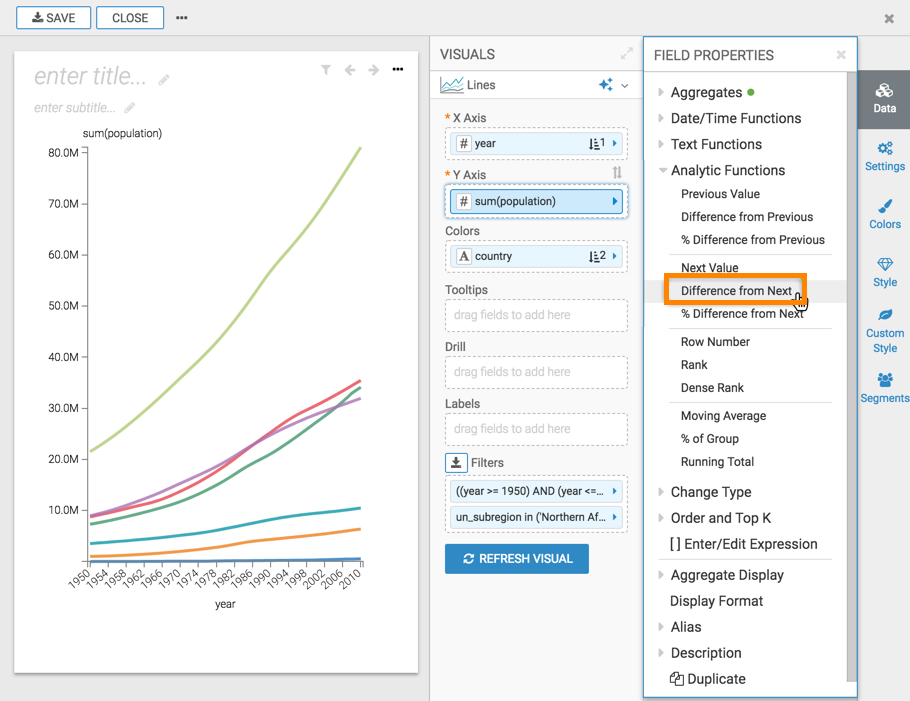
In the FIELD PROPERTIES menu, expand Analytic
Functions, and select Difference from Next.
-
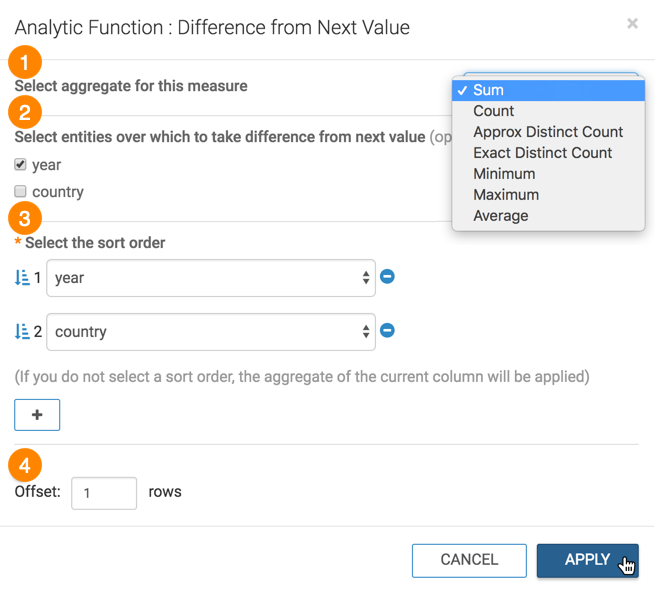
In the Analytic Function: Difference from Next Value modal
window,
-
In Select aggregate for this measure, leave the default Sum. The other aggregation options are Count, Minimum, Maximum, and Average. In addition, some connection types also support Approximate Distinct Count and Exact Distinct Count.
-
Under Select entities over which to take difference from next value, select year. This is the grouping that applies when calculating the difference from next values.
-
Under Select the sort order, you can specify the order of sorting. This order specifies what the next row is, and the row where the value is taken. If your visual already specifies sorting order, these values appear in the modal.
In this example, leave the default order: year ascending, followed by country ascending.
- Under Offset, specify the number of next rows over which the function executes.
-
-
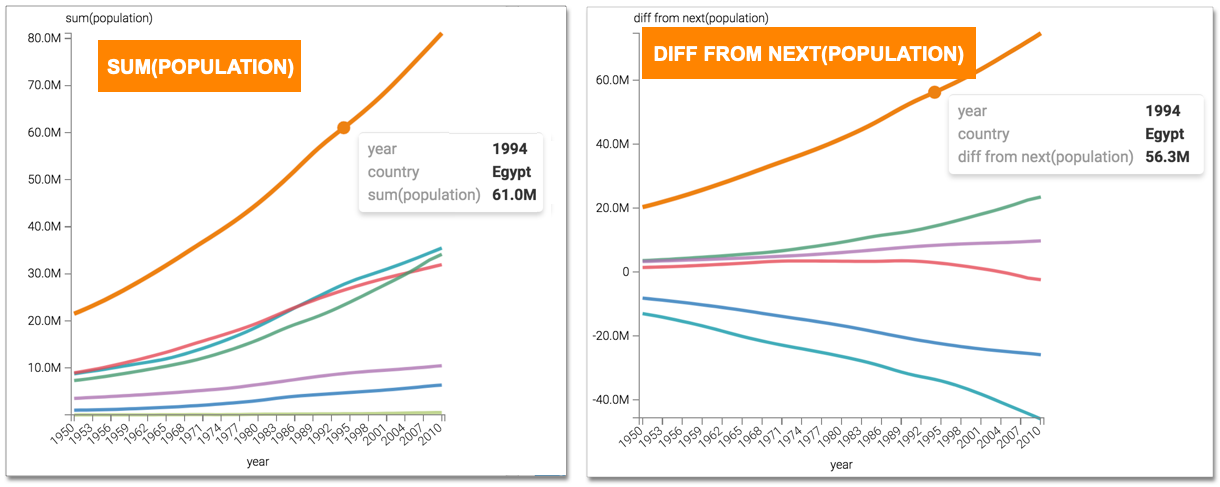
Click REFRESH VISUAL.
You can see the change to the appearance of the visual, and the change in values that appear on the tooltip.