Displaying area legend
In an interactive map visual, Cloudera Data Visualization enables you to display area legend of circles.
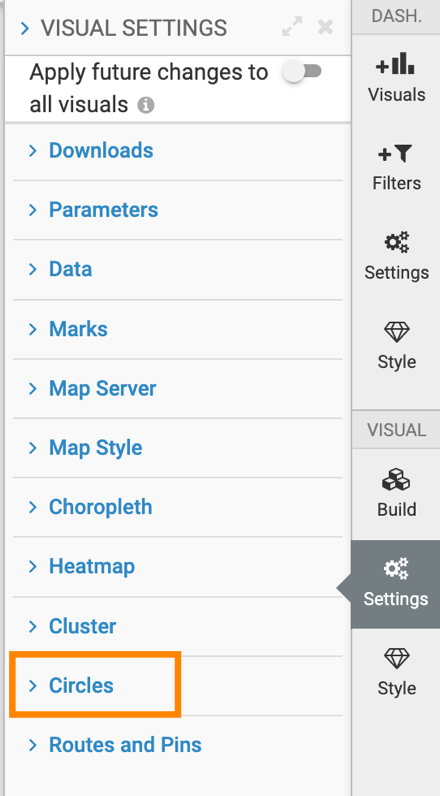
- In the Settings menu, click
Circles.
-
To show the area legend for Circles, select the
Add Area Legend option.
This option is off by default.
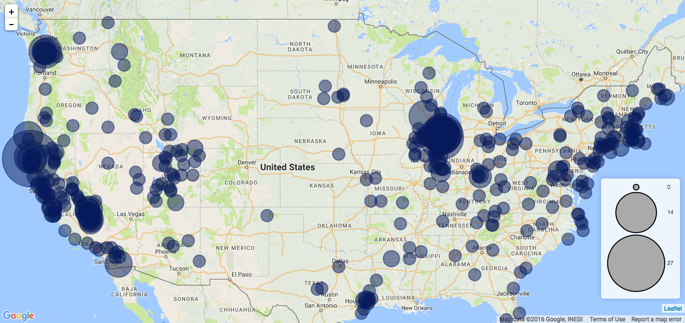
The following image shows a Google Map with Circles where the area legend now appears on the lower-right corner of the map.
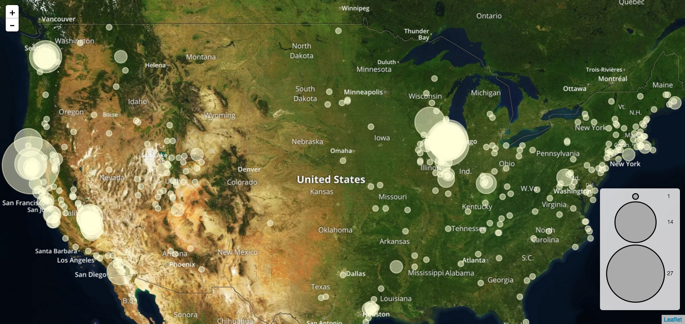
The following image shows a Mapbox Map with Circles and an area legend.