Displaying a linear trendline
Cloudera Data Visualization enables you to create a linear trendline. A linear trendline is a best-fit straight line that is used with simple linear data sets. The data is linear if the system data points resemble a line. A linear trendline usually shows that something is increasing or decreasing at a steady rate.
To display a linear trendline for the graph, navigate to the Trendline menu, and select Display linear trendline.

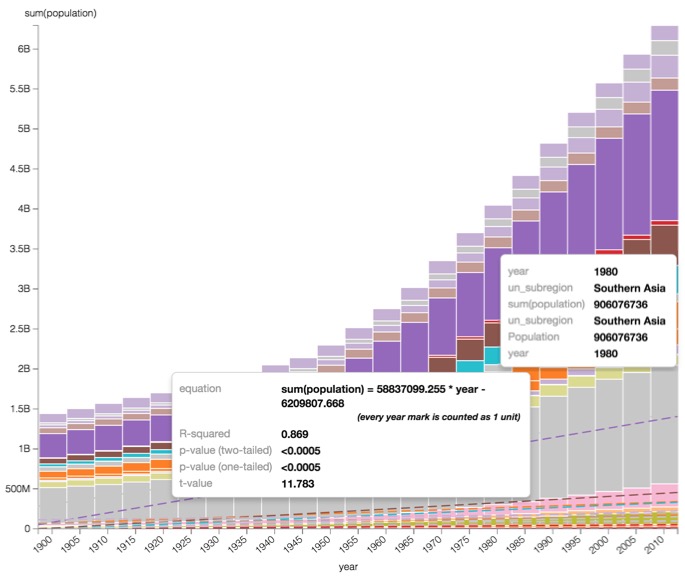
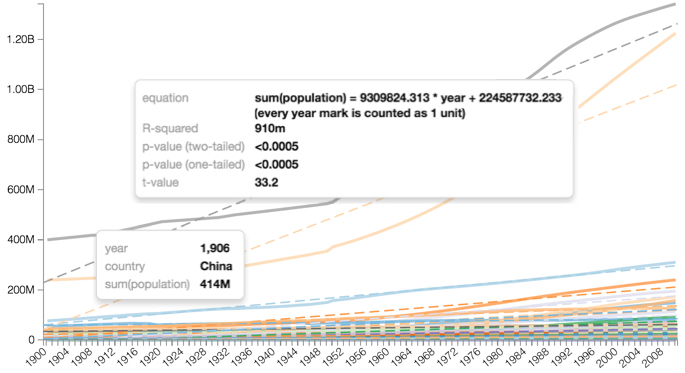
Note that the trendlines appear on the visual. To see the specific values related to the calculation of the trendline, hover your mouse over the trendline and examine the information in the Tooltip window.
Here is a line visual with trendlines. In the following example, notice that a linear trendline clearly shows that population of China has consistently risen over the years.
Here is a bar visual with trendlines. In the following example, notice that a linear trendline clearly shows that the population of Southern Asia has consistently risen over the years.