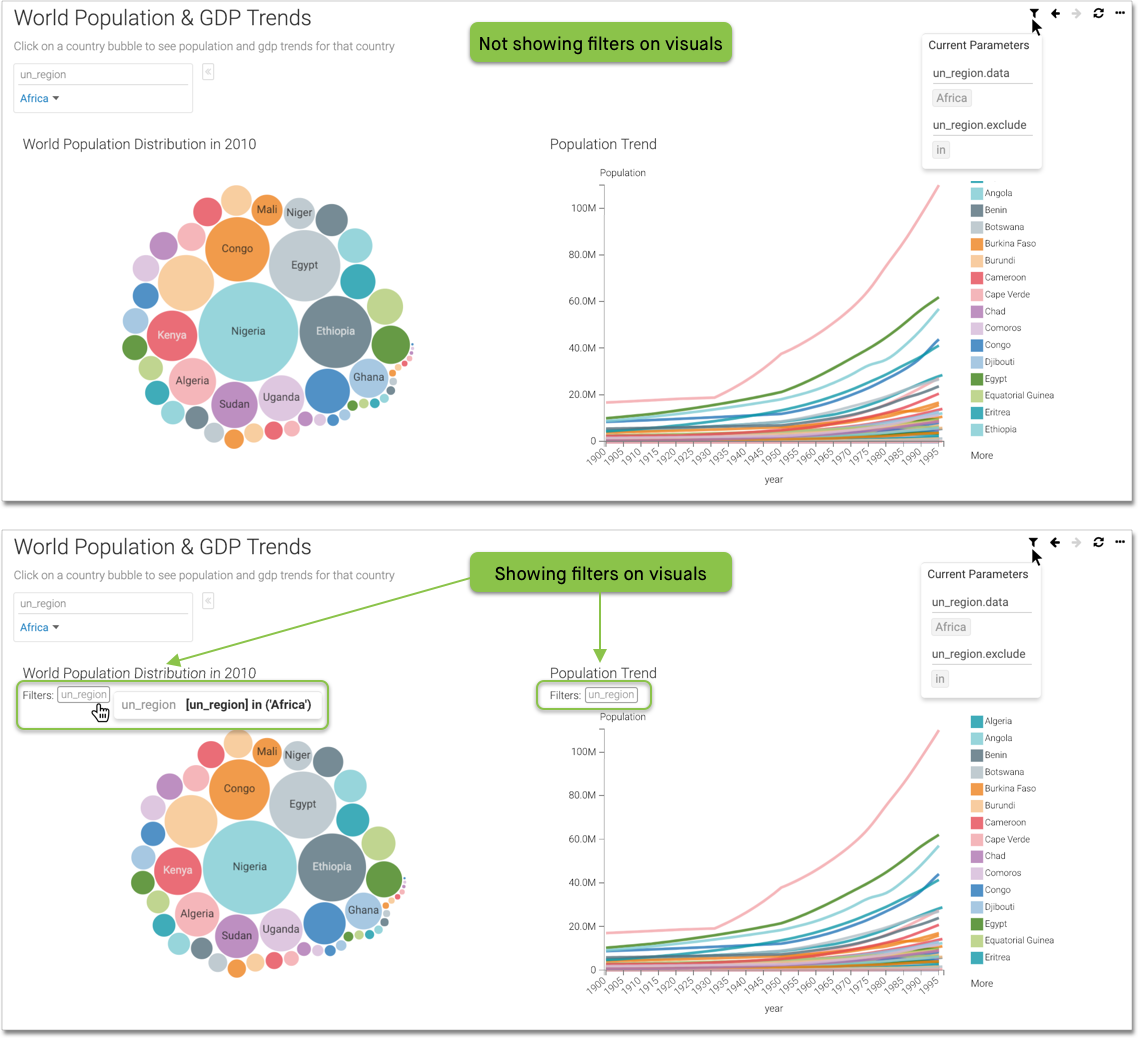
Displaying filter selections for each visual

You can display filter selections for the visuals of a dashboard in CDP Data Visualization.
To show active filter selections for each visual in the dashboard, navigate to the General menu, and select the Display filter selections for each visual option.

For example, compare the two dashboards:
  • The top dashboard displays filters parameters when you hover the pointer over the filter icon at the top right corner of the dashboard, but not on the visuals themselves.
  • The bottom dashboard displays filters and parameters both at the top right corner, and on each visual modified by the filter.