Cloudera Data Visualization ▶︎ Top Tasks ▶︎ Deploying Cloudera Data Visualization Deploying Cloudera Data Visualization in Cloudera Data Warehouse Deploying Cloudera Data Visualization in Cloudera AI Deploying Cloudera Data Visualization in Cloudera Data Science Workbench ▶︎ Connecting to a data source Cloudera AI data connection to Impala Cloudera AI data connection to Hive Cloudera Data Warehouse data connection CDSW data connection Creating a visual ▶︎ Release Notes ▶︎ What's new 7.2.9 7.2.8 7.2.7 ▶︎ Older releases 7.2.6 7.2.5 7.2.4 7.2.3 7.2.2 7.2.1 7.2.0 7.1.9 7.1.8 7.1.7 7.1.6 7.1.5 7.1.4 7.1.3 7.1.2 7.1.1 7.1.0 7.0.5 7.0.4 7.0.3 7.0.2 7.0.1 7.0.0 December 17, 2021 - CVE-2021-44228 December 10, 2021 November 8, 2021 September 30, 2021 August 24, 2021 July 30, 2021 June 4, 2021 April 29, 2021 April 7, 2021 February 26, 2021 February 2, 2021 December 15, 2020 December 3, 2020 October 30, 2020 ▶︎ Known issues 7.2.9 7.2.8 7.2.7 ▶︎ Older releases 7.2.6 7.2.5 7.2.4 7.2.3 7.2.2 7.2.1 7.2.0 7.1.9 7.1.8 7.1.7 7.1.6 7.1.5 7.1.4 7.1.3 7.1.2 7.1.1 7.1.0 7.0.5 7.0.4 7.0.3 7.0.2 7.0.1 7.0.0 ▶︎ Concepts ▶︎ Overview Data Visualization in Cloudera ▶︎ User interface Home SQL Visuals Data ▶︎ Connections Data connections User impersonation in Cloudera Data Warehouse ▶︎ Data Datasets Data extracts Data modeling Data joins ▶︎ Visuals What is a visual? Visual Builder ▶︎ Dashboards What is a dashboard? Dashboard Designer ▶︎ Applications What is an application? App Designer ▶︎ Workspaces Workspaces Private workspace Public workspace Custom workspace ▶︎ Artifact Migration Export and import Supported visual artifacts Data compatibility ▶︎ Jobs Jobs Job runs Scheduled jobs Schedule intervals Job details ▶︎ Logs and Usage Activity Log Usage Analytics [Technical Preview] Daily Usage WebServer Stats Current Load WebServer Log ▶︎ Notifications Notification center ▶︎ Filters and Parameters Filter shelves Filter scope Filter widgets Syntax for using parameters ▶︎ Natural Language Search Natural language search UI Search results Search bookmarks Search history Search types Global search ▶︎ Security Security model Role-based access control Permissions Role privileges All groups requirement RBAC setup for dataset publishing ▶︎ Advanced Analytics Advanced Analytics overview ▶︎ Complex data types STRUCT data type ARRAY data type MAP data type Dimension hierarchies Segments Events ▶︎ Visuals for analytics Combined bar/line visuals ▶︎ Advanced visualization techniques Trellised visuals Derived data ▶︎ Deployment ▶︎ Using Cloudera Data Visualization in Cloudera Data Warehouse Deploying Cloudera Data Visualization in Cloudera Data Warehouse Editing and deleting Cloudera Data Visualization instances Upgrading Cloudera Data Visualization Backing up and restoring Cloudera Data Visualization ▶︎ Using Cloudera Data Visualization in Cloudera AI Deploying Cloudera Data Visualization in Cloudera AI Using Data Discovery and Visualization Upgrading Cloudera Data Visualization Restoring a Cloudera Data Visualization version ▶︎ Using Cloudera Data Visualization in Cloudera Data Science Workbench Deploying Cloudera Data Visualization in Cloudera Data Science Workbench Using Cloudera Data Visualization in air-gapped Cloudera Data Science Workbench deployment ▶︎ Quickstart Understand the UI ▶︎ Set up your data Create a data connection Creating a dataset Create a visual Create a dashboard Create an app ▶︎ How To: Connections ▶︎ Connecting to Data ▶︎ Connecting to a data source Cloudera AI data connection to Impala Cloudera AI data connection to Hive Cloudera Data Warehouse data connection CDSW data connection ▶︎ Managing data connections Editing a data connection Setting concurrency for a data connection Setting warning if query loads for too long Deleting a data connection ▶︎ Connection Explorer Discovering Connection Explorer Previewing data table details ▶︎ Direct Access Running a SQL query Downloading query results ▶︎ Adding data Importing data in CSV format Adding data through URL Changing locale setting Preparing Excel files for data import ▶︎ Working with Data ▶︎ Working with datasets Creating a dataset Finding a dataset Cloning a dataset Deleting a dataset ▶︎ Exploring dataset details Tables Connection Description Join elimination Result cache SQL for first table Information on creation date and updates Checking related dashboards Tracking dataset versions [Technical Preview] ▶︎ Changing dataset fields Editing dataset fields Hiding dataset fields from applications Changing field aggregation Creating calculated fields ▶︎ Changing the field display format Currency field display Custom field display Custom Javascript field display Changing data type Specifying geographic fields ▶︎ Adding field comments Adding field comments in dataset Viewing field comments in Visual Builder Automatically renaming dataset fields Custom renaming dataset fields Refreshing a dataset ▶︎ Editing datasets based on a SQL query Restricting columns in datasets based on SQL query Restricting rows in datasets based on SQL query ▶︎ Working with data models Creating a join Changing join types Editing join details Deleting a join Applying field display format Working with data profiling ▶︎ Working with data extracts Creating a data extract Exploring data extract details Running a data extract Creating dataset from data extract Editing a data extract Deleting a data extract ▶︎ How To: Visualization ▶︎ Visuals Creating a visual Cloning a visual Linking visuals Unlinking visuals Emailing a visual Exporting a visual Importing a visual ▶︎ Downloading visuals Downloading a visual as PNG file Downloading a visual as PDF file Downloading visual data to CSV file Downloading visual data to Excel file Removing a visual Deleting a visual Adding filters to a visual Exploring visual options ▶︎ Visual type catalog ▶︎ Table Shelves for tables ▶︎ Saving tables Saving a table as a materialized table Saving a table as a logical view Saving a table as a dataset based on the query ▶︎ Cross tabulation ▶︎ Displaying totals with data expansion Configuring a cross tabulation visual for expansion Displaying subtotals and totals Hiding data and subtotal rows Shelves for cross tabulation ▶︎ Bars Filtering by year Filtering by region Horizontal bars Stacked bars Labelled bars Shelves for bars ▶︎ Lines Lines with dual axes Shelves for lines ▶︎ Combined bar/line visuals Creating basic combos Using secondary axis Change line to area Shelves for combos ▶︎ Areas Using trellis option with areas Using trellis option with independent scale Shelves for areas ▶︎ Grouped bars Shelves for grouped bars ▶︎ KPI Shelves for KPIs ▶︎ Gauge Shelves for gauges ▶︎ Row listing Shelves for row listing visuals ▶︎ Bullet Shelves for bullets ▶︎ Box plot Shelves for box plots ▶︎ Packed bubbles Shelves for packed bubbles ▶︎ Word cloud Trellised word clouds Shelves for word clouds ▶︎ Scatter Basic scatter Adding size Adding transition animation Adding trellis Shelves for scatters ▶︎ Pie Shelves for pies ▶︎ Radial Trellised radial Shelves for radials ▶︎ Chord Shelves for chords ▶︎ Network Shelves for networks ▶︎ Advanced options for networks Same source and target data values Link color menu Link color shelf Link width shelf Link legend Node size shelves Nodes color menu Node color shelves Node legend ▶︎ Dendrograms Shelves for dendrograms ▶︎ Treemap Shelves for treemaps ▶︎ Correlation heatmap Shelves for correlation heatmaps ▶︎ Correlation flow Shelves for correlation flows ▶︎ Calendar heatmaps Shelves for calendar heatmaps ▶︎ Maps Choropleth country map Country map, bubbles State map, choropleth State map, bubbles County map, choropleth County map, bubbles Zipcode map, bubbles Lat/long map, bubbles Choropleth DMA map Province map, choropleth Province map, bubbles Choropleth Canadian postal code map Canadian postal code map, bubbles Shelves for maps ▶︎ Interactive maps Basic interactive map Choropleth interactive maps Interactive maps, multiple dimensions Interactive maps, multiple measures Changing the map server Changing layer options Plotting routes Using alphabetic values Segmenting data qualitatively Shelves for interactive maps ▶︎ Sparklines Using sparklines Shelves for sparklines ▶︎ AI visual Shelves for AI visual Action Search ▶︎ Timeline Shelves for timelines ▶︎ External link visuals Setting up dynamic external links Shelves for external links ▶︎ Histograms Bucket count Data range Normalized histograms Cumulative option Shelves for histograms ▶︎ Extensions Examples of extensions ▶︎ Rich texts Inserting URL links Inserting tables Inserting images from local machine Inserting images from static assets Resizing images Inserting videos Field statistics SQL queries ▶︎ Dashboards Creating a dashboard Customizing dashboard layout Opening a dashboard Cloning a dashboard Adding a dashboard to favorites Setting a dashboard as homepage Getting dashboard URL Emailing a dashboard ▶︎ Downloading a dashboard Downloading dashboard as PNG ▶︎ Downloading dashboard as PDF Downloading current sheet as PDF Downloading all sheets as PDF Downloading current sheet with one visual per page as PDF Exporting a dashboard Importing a dashboard ▶︎ Moving a dashboard Cloning linked visuals Moving linked visuals Moving dashboards between workspaces Refreshing visuals manually Deleting a dashboard ▶︎ Sheets Creating a new sheet Adding visuals to a sheet Adding a filter to a sheet Renaming a sheet Reordering sheets Reordering sheet IDs ▶︎ Cloning a sheet Cloning an internal sheet in a dashboard Cloning an external sheet in a dashboard ▶︎ Downloading a sheet Downloading dashboard as PNG Downloading all sheets as PDF Downloading current sheet as PDF Downloading current sheet with one visual per page as PDF Emailing sheets Deleting a sheet ▶︎ Applications Creating a new application Adding tabs to applications Removing a tab from an application Adding dashboards to tabs Removing a dashboard from a tab Changing datasets in applications Rearranging dashboards Rearranging tabs Launching applications Moving apps between workspaces Cloning an application Exporting an app Importing an application Deleting an app ▶︎ Workspaces Creating a workspace Editing a workspace Deleting a workspace ▶︎ How To: Monitoring ▶︎ Monitoring Dashboard Performance Showing usage information ▶︎ How To: Advanced Analytics ▶︎ Working with Dimension Hierarchies Creating new dimension hierarchies Changing the name of the hierarchy Changing the order of components in the hierarchy Adding levels to the hierarchy Removing levels from the hierarchy Deleting dimension hierarchies Hierarchy drill into support on the color shelf ▶︎ Working with Segments Creating segments Cloning segments Editing segments Creating entity segments Deleting segments Creating segments from filter definitions Using segments in visuals ▶︎ Working with Events Creating events Cloning events Editing events Deleting events ▶︎ Using Advanced Visualization Techniques Trellis on dimensions Trellis on measures Multiple measure analysis Line visuals with dual axes Working with dimension hierarchies Hierarchical cross tabulation visuals Adding highlights to visuals ▶︎ Using Analytic Functions Supported connections Using analytic functions - basic steps Setting up a basic visual for aggregates Setting up a basic visual for single values Previous value analytic function Difference from previous value analytic function Percentage difference from previous value analytic function Next value analytic function Difference from next value analytic function Percentage difference from next value analytic function Row number function Rank analytic function Dense rank analytic function Moving average analytic function Percent of group analytic function Running total analytic function ▶︎ Working with Derived Data Defining derived data Defining additional derived data Using derived data Viewing derived data definitions Saving derived data with full context Deleting derived data definitions ▶︎ Working with Legends in Visuals Highlighting elements by hovering over legend Filtering on an element ▼ How To: Customization ▼ Visuals ▼ Customizing settings ▶︎ General settings Enabling animations Enabling Drill Into data discovery ▶︎ Basic visual settings Bucket count Normalized histograms Cumulative option ▶︎ Downloads settings Enabling CSV download Enabling quotation marks in CSV download Enabling Excel download in visuals Setting the locale for CSV downloads ▶︎ Axes for visuals Changing axis scale Changing axes scale for radial graphs Enabling gridlines Enabling continuous axis for date/time values Change padding on X axis Change padding on Y axis Starting aggregate scale at zero Changing min/max of aggregate scale Showing or hiding axis labels Change dimension text size Showing or hiding axis Reversing axis scale Dynamically sizing graph Setting maximum row label length Setting column label length Enabling continuous X axis Changing scale of continuous X axis Enabling continuous Y axis Changing scale of continuous Y axis Enabling continuous axis on dimensions Changing scale of continuous axis on dimensions ▶︎ Data for visuals Ordering NULL rows Changing number of rows to download Changing maximum number of rows to fetch Disabling incremental queries Displaying NULL rows Enabling URL links Specifying qualitative range as percentages ▶︎ Links Changing link color Changing link opacity Changing link width range Changing link distance Changing link strength Adding arrow direction to links Changing direction arrow size Adding link legend Changing links legend name ▶︎ Map options Selecting map view ▶︎ Marks Displaying tooltips Showing detail data button in context menu Showing context menu Showing table data as HTML Showing adjacent duplicate values Showing expansion totals above expansion rows Displaying title for subtotal rows Adding and removing legend Changing legend item width Changing legend width Reversing legend order Displaying a linear trendline Separating trendlines by color Changing trendline number of decimals Showing a selection brush for ranges Showing measure values inside bars Changing bar size range Separating histogram columns Showing dimension values on hovering Showing points Ignoring missing date values Changing line shape Changing line style Changing highlight type Converting line to area visual Changing highlight of radius Changing mark size range Changing transition delay Showing autoplay transition animation Showing dimensions as marks Showing percentages as marks Changing number of decimals Changing display to overlap Showing the same source and destination values Changing size of chord visual Displaying bubbles on maps Changing layout gravity Changing layout theta Showing node labels Tokenizing input Displaying gauge needle Displaying gauge line on qualitative arc Displaying axis ticks Changing outer width Changing qualitative thickness Changing arc gap Changing arc thickness Changing label font size Changing label offset Changing sublabel font size Changing sublabel offset Making box plots horizontal Changing outline width Changing font size of main indicator Changing value of main indicator Using same color for main indicator as arrow Displaying first measure as main indicator Changing compare indicator value Changing compare indicator position Changing arrow type Flipping compare indicator Changing label indicator position Changing label indicator font size Ignoring negative values Changing approximate tick count Orienting bars vertically Removing default label Staying at same map location Setting minimum cell size ▶︎ Nodes Remembering node positions Showing same source and target values Changing source node mark Changing target node mark Changing combined node mark Changing node size range Changing node friction Changing node charge Changing node opacity Showing node labels Adding nodes legend Changing nodes legend name ▶︎ Parameters Using parameters with explicit scope Sending parameters with dataset scope Sending aggregates as parameters ▶︎ Map server Customizing map server Specifying mapbox key for visual Specifying atlas mapbox server for visual ▶︎ Map style Changing map style of visual Adding custom mapbox style ▶︎ Choropleth Specifying choropleth layer ID Specifying choropleth opacity Displaying legend in choropleth map Remembering location of map ▶︎ Heatmap Displaying heatmap Changing heatmap radius Changing intensity magnification Showing heatmap legend Changing visible zoom levels in heatmap ▶︎ Cluster Displaying cluster Changing cluster color Changing cluster radius ▶︎ Circles Displaying circles Displaying color legend Displaying area legend Changing circle radius range Changing visible zoom levels in circles ▶︎ Routes and pins Enabling routes Enabling pins Selecting pin types Selecting start pin type Selecting middle pin type Selecting end pin type Specifying a custom icon Changing custom icon size ▼ Tooltip Showing percentage Specifying label for percentage Changing number of decimals for percentage Changing tooltip font size Changing tooltip font family ▶︎ Trellis Displaying trellis borders Enabling independent axis scale Setting minimum trellis cell width Setting minimum trellis cell height ▶︎ Zoom Enabling pan and zoom Enabling zoom to active areas ▶︎ Customizing visual style ▶︎ Visual basics Changing font family Changing font size Changing background color ▶︎ Table styles Changing table templates Changing cross tabulation header alignment Adjusting table width Wrapping column contents Showing column totals Showing header for column totals Showing column page totals Showing header for column page totals Specifying totals column font weight Specifying maximum number of columns Showing row information Showing pagination Specifying number of rows per page Showing header column Showing header column borders Adjusting table column width ▶︎ Table styles Adjusting cross tabulation width Adjusting cross tabulation column width Changing cross tabulation header font Changing table header font size Changing cross tabulation header font weight Changing cross tabulation cell padding Changing cross tabulation border width Showing cross tabulation column totals Showing cross tabulation row totals Specifying font weight for totals column in cross tabulation Specifying font weight for totals row in cross tabulation Changing cross tabulation header alignment Changing cross tabulation content alignment ▶︎ Table and cross tabulation colors Changing table header background color Changing table header text color Changing table odd rows background color Changing table even rows background color Changing table odd rows text color Changing table even rows text color Changing table border color Changing totals row background color Changing totals row text color ▶︎ Visual titles Changing font family in the title of a visual Changing font size in the title of a visual Changing font weight in the title of a visual Changing text alignment in the title of a visual Hiding the title of a visual ▶︎ Visual subtitles Changing font family in the subtitle of a visual Changing font size in the subtitle of a visual Changing text alignment in the subtitle of a visual ▶︎ Visual axes and labels Axis label font size in a visual Ticks font size in a visual Label font size in a visual Label text color in a visual Trellis font size in a visual Legend font size in a visual ▶︎ Tooltips Changing tooltip font family Changing tooltip font size ▶︎ Aggregate row styles Changing font style in the aggregate row of a visual Changing font weight in the aggregate row of a visual ▶︎ Customizing visual colors Reverse color palette of visuals Visual color palette Colors option Foreground color Pointer color Background color Arrow color Color opacity on visuals Link color Drop off color Highlight color Projection opacity Background opacity Consistent colors on dimension values Colors for specified values Colors for KPI visuals ▶︎ Adding custom styles to visuals Adding CSS classes to visuals Adding included styles to visuals Searching custom styles in visuals Sorting custom styles in visuals Adding inline CSS code to visuals ▶︎ Dashboards ▶︎ Customizing general settings for dashboards Changing dashboard width Enabling animations Enabling manual refresh of visuals Adjusting horizontal margins Adjusting vertical margins Displaying a visual in full screen Adjusting detailed data columns Displaying filter selections for each visual Displaying context menus in visuals Overriding visual style settings Adjusting automatic refresh Enabling or disabling case sensitive dashboard filters Enabling viewing data in dashboard visuals Rendering visuals after filters in dashboards ▶︎ Customizing download settings for dashboards Enabling PNG and PDF download for dashboards Changing dashboard scale for PDFs Selecting page size for PDF downloads Selecting page orientation for PDF downloads Enabling headers/footers when printing in PDF Enabling CSV/Excel download for dashboard visuals Enabling email for a dashboard Showing borders around visuals ▶︎ Customizing dashboard style ▶︎ Basics styles Dashboard text color Dashboard background color Dashboard page background color ▶︎ Dashboard titles styles Dashboard titles font family Dashboard titles font size Dashboard titles font weight Dashboard titles text color Dashboard titles background color Dashboard titles alignment Hiding dashboard titles ▶︎ Dashboard subtitles styles Dashboard subtitles font family Dashboard subtitles font size Dashboard subtitles text color Dashboard subtitles background color Dashboard subtitles alignment ▶︎ Dashboard filter styles Aligning dashboard filters Using filter labels inline Hiding filters line separator Hiding borders for filters in dashboards Changing dashboard filter font Changing dashboard filter font size Changing text color for dashboard filter Changing selected text color for dashboard filter Changing container color for dashboard filter Changing background color for dashboard filter ▶︎ Visual basics styles in dashboards Visual basic font family in dashboards Visual basic font size in dashboards Visual basic background color in dashboards ▶︎ Visual border styles in dashboards Show borders on visuals in dashboards Change visual border color in dashboards Change visual border radius in dashboards ▶︎ Visual titles styles in dashboard Visual title font family in dashboards Visual title font size in dashboards Visual title font weight in dashboards Visual title text color in dashboards Visual title background color in dashboards Visual title alignment in dashboards ▶︎ Visual subtitles styles in dashboard Visual subtitle font family in dashboards Visual subtitle font size in dashboards Visual subtitle text color in dashboards Visual subtitle background color in dashboards Visual subtitle alignment in dashboards ▶︎ Visual axes and labels styles in dashboards Axis label font size in dashboards Axis ticks font size in dashboards Visual label font size in dashboards Visual label title text color in dashboards Visual trellis font size in dashboards Visual legend font size in dashboards ▶︎ Tooltips in dashboards Tooltip font family in dashboards Tooltip font size in dashboards ▶︎ Adding custom styles to dashboards Adding CSS classes to dashboards ▶︎ Adding included styles to dashboards Searching custom styles in dashboards Sorting custom styles in dashboards Adding inline CSS code to dashboards Resetting dashboard style Customization example for multi-page table visuals ▶︎ Applications ▶︎ Changing application style ▶︎ Customizing menu bar style for applications Menu on left Background color Bottom bar color Selected color ▶︎ Customizing menu text for apps Font family Font size Font weight Text color Selected text color Uppercase ▶︎ Customizing logo for apps Logo image Logo width Logo height Logo top margin Logo left margin ▶︎ Customizing app background App background color Dashboard shadow ▶︎ Adding custom styles to apps Adding CSS classes to applications Adding included styles to applications Adding inline CSS code to apps Enabling navigation from logo ▶︎ Field Properties Adding and removing aggregates Customizing date/time functions Adjusting text display options Customizing analytic functions Changing field type Customizing order and top K Customizing enter/edit expressions Customizing calculated display Enabling expansion ▶︎ Customizing display format Real number Integer Percentage Scientific Currency Date/time ▶︎ Using custom display configurations Using custom display formats for large numbers Customizing display format using Javascript Using alias Changing column position Customizing description Duplicating an item ▶︎ Homepage Setting your homepage from a dashboard Setting your homepage with Set Homepage Setting default homepage for all users Resetting homepage to default ▶︎ How To: Natural Language Search ▶︎ Configuring Natural Language Search Enabling Search in Site Settings Enabling a dataset for NLS Specifying a group for a dataset Specifying fields for a dataset Specifying synonyms for a dataset Specifying default aggregation field for a dataset Specifying suggested questions for dataset Specifying word substitutions for a dataset Configuring date and time ▶︎ Using Natural Language Search Using Search in embedded mode ▶︎ Working with search visuals Creating a search visual Using the search visual in a dashboard Changing dataset search domain Changing result visual type through explore ▶︎ How To: Development ▶︎ Filter Scope Setting explicit scope for filters Setting dataset scope for filters Setting app scope for filters ▶︎ Filter Shelves Selecting discrete values on filter shelves Selecting a range of number values on filter shelves Selecting a string pattern for values on filter shelves Selecting a range of dates on filter shelves Selecting values by using an expression on filter shelves ▶︎ Click Behavior Between Visuals Creating control visual Creating target visual Creating application and enabling click Enabling Click Receive on target visual Exploring Click behavior ▶︎ Using Filter Widgets on Dashboards Creating dataset filters Creating custom filters ▶︎ Creating date and time filters Using fixed dates mode Using relative dates mode Using quick filters Including null values in date filters Setting parameters through URL Customizing output parameters Configuring ranges on a date/time filter Configuring data options for a dashboard filter ▶︎ Configuring display settings for a dashboard filter Displaying a textbox parameter Changing the width of the filter text box Entering values manually Using single value mode with radio buttons Selecting all values Using single value with dropdown menu Displaying distinct parameters Hiding filters Remembering previous selections when searching Using multi-select mode Configuring dashboard filter scope ▶︎ Configuring custom style for a dashboard filter Configuring custom style using CSS code Moving filter widgets ▶︎ Receiving Parameters in Dashboards Visuals with optional dimensions Filters to control optional dimensions Visuals with optional measures Filters to control optional measures Visuals with variable dimensions Filters controling variable dimensions Visuals with variable measures Filters controling variable measures ▶︎ Configuring Cascading Filters Creating dashboard Adding filters to dashboard Configuring filters and enabling cascading filter interaction Exploring dashboard filter interaction ▶︎ Embedding ▶︎ Embedding apps with client pages Embedding apps with unauthenticated access ▶︎ Embedding apps with trusted authentication Overview of trusted authentication process Enabling trusted authentication Authenticating embedded requests Embedding a dashboard without header Embedding a jobs status page without header ▶︎ How To: Administration ▶︎ Jobs Creating new email jobs Rerunning jobs Deleting job logs Pausing and resuming jobs Changing job owner Editing jobs Deleting scheduled jobs Creating new schedule intervals Editing schedule intervals Deleting schedule intervals ▶︎ Users and User Groups Creating new user accounts Editing accounts Changing user passwords Promoting a user to administrator Creating new administrator accounts Inactivating user accounts ▶︎ Assigning roles to users Assigning roles to a single user Assigning roles to multiple users Assigning multiple roles to multiple users ▶︎ Deleting user accounts Deleting individual user accounts Deleting several user accounts Creating new user groups Editing user groups ▶︎ Adding users to user groups Adding a user to multiple groups; user modal Adding multiple users to a single group; group modal Adding multiple users to multiple groups; users tab Assigning roles to user groups Deleting user groups ▶︎ URL Aliases Managing URL aliases Editing URL aliases ▶︎ API Keys Enabling API keys Creating new API keys Changing API keys Deleting API keys ▶︎ Email Templates Creating new email templates Changing email templates Cloning email templates Deleting email templates ▶︎ Custom Styles Adding custom styles to visuals Defining site-wide custom styles CSS custom styles JavaScript custom styles Modifying site-wide custom styles Deleting site-wide custom styles Searching site-wide custom styles Sorting site-wide custom styles ▶︎ Custom Colors Managing custom colors Creating new custom colors Creating custom colors with distinct colors Creating custom colors with gradient values Creating custom colors with gradient percentages Editing custom colors Deleting custom colors ▶︎ Custom Dates Managing custom dates Creating new custom date ranges Cloning custom date ranges Deleting custom date ranges ▶︎ Static Assets Managing static assets Creating new assets Viewing an existing asset Changing existing assets Automatically uploading assets Deleting an existing asset ▶︎ Site Settings Data Dashboards Email Site configuration AI settings [Technical Preview] Security and authentication Debugging and logs Version control Help and support Advanced settings ▶︎ How To: Security ▶︎ Working with User Roles Creating new roles Adding privileges Setting system privileges Setting role privileges Setting connection privileges Setting dataset privileges Editing role assignments Assigning roles to users Assigning roles to user groups Assigning multiple roles to multiple users Deleting roles ▶︎ Configuring Account Lockout Configuring account lockout Unlocking account ▶︎ Publishing Datasets Configuring dataset recipient roles Publishing datasets Configuring the dataset publisher role Defining groups for teams and access levels Assigning groups to roles Assigning users to groups ▶︎ Restricting Row-Level Access Setting segments Creating users and user groups Setting roles Setting filter associations Verifying access restriction on a visual ▶︎ Configuring User Authentication Using LDAP Enabling LDAP authentication Using LDAPS Complex matching logic for group queries using LDAPGroupQuery() ▶︎ How To: APIs ▶︎ How-To Data APIs Enabling Data APIs Using API keys Accessing Data API request payload ▶︎ Migrating visual artifacts with REST APIs Exporting with REST APIs Importing with REST APIs ▶︎ How-To Admin APIs Enabling admin API support Admin API demo page Setting up a session Retrieving or changing logging level ▶︎ References ▶︎ Data API Data API Data API request payload Data API response payload Example of data API usage ▶︎ Admin API Admin API Admin API syntax and general usage Admin API syntax parameters Python Admin API data format and response CURL data format and API key examples ▶︎ Admin API Demo Admin API demo examples Data type details Users Groups Roles Segments Filter associations API Workspaces ▶︎ Custom Style Extensions for Javascript and CSS Extension JS API endpoints Extension JS API arcapi functions Extension CSS APIs ▶︎ Enumerated Values Enumerated values ▶︎ Display Formats Display format reference Standard format specifier Format style table Quantity prefixes Additional format examples Date/time formats ▶︎ RBAC Permissions Permission levels for role-based access ▶︎ Email Job Parameters Parameters for jobs ▶︎ Email Development Recommendations Email design best practices Email development best practices ▶︎ Certifications Certifications Supported metastores Mobile devices Internet browsers ▶︎ Natural Language Search Icons for search types Terms for basic filters Terms for ranking Terms for aggregation Terms for sorting Terms for comparing data points Terms for visual types Terms for dimension field matching Terms for time series 7.0.0 7.0.0 7.0.1 7.0.1 7.0.2 7.0.2 7.0.3 7.0.3 7.0.4 7.0.4 7.0.5 7.0.5 7.1.0 7.1.0 7.1.1 7.1.1 7.1.2 7.1.2 7.1.3 7.1.3 7.1.4 7.1.4 7.1.5 7.1.5 7.1.6 7.1.6 7.1.7 7.1.7 7.1.8 7.1.8 7.1.9 7.1.9 7.2.0 7.2.0 7.2.1 7.2.1 7.2.2 7.2.2 7.2.3 7.2.3 7.2.4 7.2.4 7.2.5 7.2.5 7.2.6 7.2.6 7.2.7 7.2.7 7.2.8 7.2.8 7.2.9 7.2.9 Accessing Data API request payload Action Activity Log Adding a dashboard to favorites Adding a filter to a sheet Adding a user to multiple groups; user modal Adding and removing aggregates Adding and removing legend Adding arrow direction to links Adding CSS classes to applications Adding CSS classes to dashboards Adding CSS classes to visuals Adding custom mapbox style Adding custom styles to apps Adding custom styles to dashboards Adding custom styles to visuals Adding custom styles to visuals Adding dashboards to tabs Adding data Adding data through URL Adding field comments Adding field comments in dataset Adding filters to a visual Adding filters to dashboard Adding highlights to visuals Adding included styles to applications Adding included styles to dashboards Adding included styles to visuals Adding inline CSS code to apps Adding inline CSS code to dashboards Adding inline CSS code to visuals Adding levels to the hierarchy Adding link legend Adding multiple users to a single group; group modal Adding multiple users to multiple groups; users tab Adding nodes legend Adding privileges Adding size Adding tabs to applications Adding transition animation Adding trellis Adding users to user groups Adding visuals to a sheet Additional format examples Adjusting automatic refresh Adjusting cross tabulation column width Adjusting cross tabulation width Adjusting detailed data columns Adjusting horizontal margins Adjusting table column width Adjusting table width Adjusting text display options Adjusting vertical margins Admin API Admin API Admin API Demo Admin API demo examples Admin API demo page Admin API syntax and general usage Admin API syntax parameters Advanced Analytics Advanced Analytics overview Advanced options for networks Advanced settings Advanced visualization techniques Aggregate row styles AI settings [Technical Preview] AI visual Aligning dashboard filters All groups requirement API Keys App background color App Designer Applications Applications Applications Applying field display format April 29, 2021 April 7, 2021 Areas ARRAY data type Arrow color Artifact Migration Assigning groups to roles Assigning multiple roles to multiple users Assigning multiple roles to multiple users Assigning roles to a single user Assigning roles to multiple users Assigning roles to user groups Assigning roles to user groups Assigning roles to users Assigning roles to users Assigning users to groups August 24, 2021 Authenticating embedded requests Automatically renaming dataset fields Automatically uploading assets Axes for visuals Axis label font size in a visual Axis label font size in dashboards Axis ticks font size in dashboards Background color Background color Background opacity Backing up and restoring Cloudera Data Visualization Bars Basic interactive map Basic scatter Basic visual settings Basics styles Bottom bar color Box plot Bucket count Bucket count Bullet Calendar heatmaps Canadian postal code map, bubbles CDSW data connection CDSW data connection Certifications Certifications Change dimension text size Change line to area Change padding on X axis Change padding on Y axis Change visual border color in dashboards Change visual border radius in dashboards Changing API keys Changing application style Changing approximate tick count Changing arc gap Changing arc thickness Changing arrow type Changing axes scale for radial graphs Changing axis scale Changing background color Changing background color for dashboard filter Changing bar size range Changing circle radius range Changing cluster color Changing cluster radius Changing column position Changing combined node mark Changing compare indicator position Changing compare indicator value Changing container color for dashboard filter Changing cross tabulation border width Changing cross tabulation cell padding Changing cross tabulation content alignment Changing cross tabulation header alignment Changing cross tabulation header alignment Changing cross tabulation header font Changing cross tabulation header font weight Changing custom icon size Changing dashboard filter font Changing dashboard filter font size Changing dashboard scale for PDFs Changing dashboard width Changing data type Changing dataset fields Changing dataset search domain Changing datasets in applications Changing direction arrow size Changing display to overlap Changing email templates Changing existing assets Changing field aggregation Changing field type Changing font family Changing font family in the subtitle of a visual Changing font family in the title of a visual Changing font size Changing font size in the subtitle of a visual Changing font size in the title of a visual Changing font size of main indicator Changing font style in the aggregate row of a visual Changing font weight in the aggregate row of a visual Changing font weight in the title of a visual Changing heatmap radius Changing highlight of radius Changing highlight type Changing intensity magnification Changing job owner Changing join types Changing label font size Changing label indicator font size Changing label indicator position Changing label offset Changing layer options Changing layout gravity Changing layout theta Changing legend item width Changing legend width Changing line shape Changing line style Changing link color Changing link distance Changing link opacity Changing link strength Changing link width range Changing links legend name Changing locale setting Changing map style of visual Changing mark size range Changing maximum number of rows to fetch Changing min/max of aggregate scale Changing node charge Changing node friction Changing node opacity Changing node size range Changing nodes legend name Changing number of decimals Changing number of decimals for percentage Changing number of rows to download Changing outer width Changing outline width Changing qualitative thickness Changing result visual type through explore Changing scale of continuous axis on dimensions Changing scale of continuous X axis Changing scale of continuous Y axis Changing selected text color for dashboard filter Changing size of chord visual Changing source node mark Changing sublabel font size Changing sublabel offset Changing table border color Changing table even rows background color Changing table even rows text color Changing table header background color Changing table header font size Changing table header text color Changing table odd rows background color Changing table odd rows text color Changing table templates Changing target node mark Changing text alignment in the subtitle of a visual Changing text alignment in the title of a visual Changing text color for dashboard filter Changing the field display format Changing the map server Changing the name of the hierarchy Changing the order of components in the hierarchy Changing the width of the filter text box Changing tooltip font family Changing tooltip font family Changing tooltip font size Changing tooltip font size Changing totals row background color Changing totals row text color Changing transition delay Changing trendline number of decimals Changing user passwords Changing value of main indicator Changing visible zoom levels in circles Changing visible zoom levels in heatmap Checking related dashboards Chord Choropleth Choropleth Canadian postal code map Choropleth country map Choropleth DMA map Choropleth interactive maps Circles Click Behavior Between Visuals Cloning a dashboard Cloning a dataset Cloning a sheet Cloning a visual Cloning an application Cloning an external sheet in a dashboard Cloning an internal sheet in a dashboard Cloning custom date ranges Cloning email templates Cloning events Cloning linked visuals Cloning segments Cloudera AI data connection to Hive Cloudera AI data connection to Hive Cloudera AI data connection to Impala Cloudera AI data connection to Impala Cloudera Data Visualization Cloudera Data Warehouse data connection Cloudera Data Warehouse data connection Cluster Color opacity on visuals Colors for KPI visuals Colors for specified values Colors option Combined bar/line visuals Combined bar/line visuals Complex data types Complex matching logic for group queries using LDAPGroupQuery() Configuring a cross tabulation visual for expansion Configuring Account Lockout Configuring account lockout Configuring Cascading Filters Configuring custom style for a dashboard filter Configuring custom style using CSS code Configuring dashboard filter scope Configuring data options for a dashboard filter Configuring dataset recipient roles Configuring date and time Configuring display settings for a dashboard filter Configuring filters and enabling cascading filter interaction Configuring Natural Language Search Configuring ranges on a date/time filter Configuring the dataset publisher role Configuring User Authentication Using LDAP Connecting to a data source Connecting to a data source Connecting to Data Connection Connection Explorer Connections Consistent colors on dimension values Converting line to area visual Correlation flow Correlation heatmap Country map, bubbles County map, bubbles County map, choropleth Create a dashboard Create a data connection Create a visual Create an app Creating a dashboard Creating a data extract Creating a dataset Creating a dataset Creating a join Creating a new application Creating a new sheet Creating a search visual Creating a visual Creating a visual Creating a workspace Creating application and enabling click Creating basic combos Creating calculated fields Creating control visual Creating custom colors with distinct colors Creating custom colors with gradient percentages Creating custom colors with gradient values Creating custom filters Creating dashboard Creating dataset filters Creating dataset from data extract Creating date and time filters Creating entity segments Creating events Creating new administrator accounts Creating new API keys Creating new assets Creating new custom colors Creating new custom date ranges Creating new dimension hierarchies Creating new email jobs Creating new email templates Creating new roles Creating new schedule intervals Creating new user accounts Creating new user groups Creating segments Creating segments from filter definitions Creating target visual Creating users and user groups Cross tabulation CSS custom styles Cumulative option Cumulative option CURL data format and API key examples Currency Currency field display Current Load Custom Colors Custom Dates Custom field display Custom Javascript field display Custom renaming dataset fields Custom Style Extensions for Javascript and CSS Custom Styles Custom workspace Customization example for multi-page table visuals Customizing analytic functions Customizing app background Customizing calculated display Customizing dashboard layout Customizing dashboard style Customizing date/time functions Customizing description Customizing display format Customizing display format using Javascript Customizing download settings for dashboards Customizing enter/edit expressions Customizing general settings for dashboards Customizing logo for apps Customizing map server Customizing menu bar style for applications Customizing menu text for apps Customizing order and top K Customizing output parameters Customizing settings Customizing visual colors Customizing visual style Daily Usage Dashboard background color Dashboard Designer Dashboard filter styles Dashboard page background color Dashboard shadow Dashboard subtitles alignment Dashboard subtitles background color Dashboard subtitles font family Dashboard subtitles font size Dashboard subtitles styles Dashboard subtitles text color Dashboard text color Dashboard titles alignment Dashboard titles background color Dashboard titles font family Dashboard titles font size Dashboard titles font weight Dashboard titles styles Dashboard titles text color Dashboards Dashboards Dashboards Dashboards Data Data Data Data API Data API Data API request payload Data API response payload Data compatibility Data connections Data Discovery with Context Menus Data extracts Data for visuals Data joins Data modeling Data range Data type details Data Visualization in Cloudera Datasets Date/time Date/time formats Debugging and logs December 10, 2021 December 15, 2020 December 17, 2021 - CVE-2021-44228 December 3, 2020 Defining additional derived data Defining derived data Defining groups for teams and access levels Defining site-wide custom styles Deleting a dashboard Deleting a data connection Deleting a data extract Deleting a dataset Deleting a join Deleting a sheet Deleting a visual Deleting a workspace Deleting an app Deleting an existing asset Deleting API keys Deleting custom colors Deleting custom date ranges Deleting derived data definitions Deleting dimension hierarchies Deleting email templates Deleting events Deleting individual user accounts Deleting job logs Deleting roles Deleting schedule intervals Deleting scheduled jobs Deleting segments Deleting several user accounts Deleting site-wide custom styles Deleting user accounts Deleting user groups Dendrograms Dense rank analytic function Deploying Cloudera Data Visualization Deploying Cloudera Data Visualization in Cloudera AI Deploying Cloudera Data Visualization in Cloudera AI Deploying Cloudera Data Visualization in Cloudera Data Science Workbench Deploying Cloudera Data Visualization in Cloudera Data Science Workbench Deploying Cloudera Data Visualization in Cloudera Data Warehouse Deploying Cloudera Data Visualization in Cloudera Data Warehouse Derived data Description Difference from next value analytic function Difference from previous value analytic function Dimension hierarchies Direct Access Disabling incremental queries Discovering Connection Explorer Discovering detailed data behind a visual Display format reference Display Formats Displaying a linear trendline Displaying a textbox parameter Displaying a visual in full screen Displaying area legend Displaying axis ticks Displaying bubbles on maps Displaying circles Displaying cluster Displaying color legend Displaying context menus in visuals Displaying distinct parameters Displaying filter selections for each visual Displaying first measure as main indicator Displaying gauge line on qualitative arc Displaying gauge needle Displaying heatmap Displaying legend in choropleth map Displaying NULL rows Displaying subtotals and totals Displaying title for subtotal rows Displaying tooltips Displaying totals with data expansion Displaying trellis borders Downloading a dashboard Downloading a sheet Downloading a visual as PDF file Downloading a visual as PNG file Downloading all sheets as PDF Downloading all sheets as PDF Downloading current sheet as PDF Downloading current sheet as PDF Downloading current sheet with one visual per page as PDF Downloading current sheet with one visual per page as PDF Downloading dashboard as PDF Downloading dashboard as PNG Downloading dashboard as PNG Downloading query results Downloading visual data to CSV file Downloading visual data to Excel file Downloading visuals Downloads settings Drill-down and drill-up data discovery Drill-into data discovery Drill-through data discovery Drop off color Duplicating an item Dynamically sizing graph Editing a data connection Editing a data extract Editing a workspace Editing accounts Editing and deleting Cloudera Data Visualization instances Editing custom colors Editing dataset fields Editing datasets based on a SQL query Editing events Editing jobs Editing join details Editing role assignments Editing schedule intervals Editing segments Editing URL aliases Editing user groups Email Email design best practices Email development best practices Email Development Recommendations Email Job Parameters Email Templates Emailing a dashboard Emailing a visual Emailing sheets Embedding Embedding a dashboard without header Embedding a jobs status page without header Embedding apps with client pages Embedding apps with trusted authentication Embedding apps with unauthenticated access Enabling a dataset for NLS Enabling admin API support Enabling animations Enabling animations Enabling API keys Enabling Click Receive on target visual Enabling continuous axis for date/time values Enabling continuous axis on dimensions Enabling continuous X axis Enabling continuous Y axis Enabling CSV download Enabling CSV/Excel download for dashboard visuals Enabling Data APIs Enabling Drill Into data discovery Enabling email for a dashboard Enabling Excel download in visuals Enabling expansion Enabling gridlines Enabling headers/footers when printing in PDF Enabling independent axis scale Enabling LDAP authentication Enabling manual refresh of visuals Enabling navigation from logo Enabling or disabling case sensitive dashboard filters Enabling pan and zoom Enabling pins Enabling PNG and PDF download for dashboards Enabling quotation marks in CSV download Enabling routes Enabling Search in Site Settings Enabling trusted authentication Enabling URL links Enabling viewing data in dashboard visuals Enabling zoom to active areas Entering values manually Enumerated Values Enumerated values Events Example of data API usage Examples of extensions Exploring Click behavior Exploring dashboard filter interaction Exploring data extract details Exploring dataset details Exploring visual options Export and import Exporting a dashboard Exporting a visual Exporting an app Exporting with REST APIs Extension CSS APIs Extension JS API arcapi functions Extension JS API endpoints Extensions External link visuals February 2, 2021 February 26, 2021 Field Properties Field statistics Filter associations API Filter data with the exclude option Filter data with the include option Filter scope Filter Scope Filter shelves Filter Shelves Filter widgets Filtering all visuals in a dashboard Filtering by region Filtering by year Filtering data with legends Filtering on an element Filters and Parameters Filters controling variable dimensions Filters controling variable measures Filters to control optional dimensions Filters to control optional measures Finding a dataset Flipping compare indicator Font family Font size Font weight Foreground color Format style table Gauge General settings Getting dashboard URL Global search Grouped bars Groups Heatmap Help and support Hiding borders for filters in dashboards Hiding dashboard titles Hiding data and subtotal rows Hiding dataset fields from applications Hiding filters Hiding filters line separator Hiding the title of a visual Hierarchical cross tabulation visuals Hierarchy drill into support on the color shelf Highlight color Highlighting elements by hovering over legend Histograms Home Homepage Horizontal bars How-To Admin APIs How-To Data APIs Icons for search types Ignoring missing date values Ignoring negative values Importing a dashboard Importing a visual Importing an application Importing data in CSV format Importing with REST APIs Inactivating user accounts Including null values in date filters Information on creation date and updates Inserting images from local machine Inserting images from static assets Inserting tables Inserting URL links Inserting videos Integer Interactive maps Interactive maps, multiple dimensions Interactive maps, multiple measures Internet browsers JavaScript custom styles Job details Job runs Jobs Jobs Jobs Join elimination July 30, 2021 June 4, 2021 Known issues KPI Label font size in a visual Label text color in a visual Labelled bars Lat/long map, bubbles Launching applications Legend font size in a visual Limiting drill-into options Line visuals with dual axes Lines Lines with dual axes Link color Link color menu Link color shelf Link legend Link width shelf Linking visuals Links Logo height Logo image Logo left margin Logo top margin Logo width Logs and Usage Making box plots horizontal Managing custom colors Managing custom dates Managing data connections Managing static assets Managing URL aliases MAP data type Map options Map server Map style Maps Marks Menu on left Migrating visual artifacts with REST APIs Mobile devices Modifying site-wide custom styles Monitoring Dashboard Performance Moving a dashboard Moving apps between workspaces Moving average analytic function Moving dashboards between workspaces Moving filter widgets Moving linked visuals Multiple measure analysis Natural Language Search Natural Language Search Natural language search UI Network Next value analytic function Node color shelves Node legend Node size shelves Nodes Nodes color menu Normalized histograms Normalized histograms Notification center Notifications November 8, 2021 October 30, 2020 Older releases Older releases Opening a dashboard Ordering NULL rows Orienting bars vertically Overriding visual style settings Overview Overview of trusted authentication process Packed bubbles Parameters Parameters for jobs Pausing and resuming jobs Percent of group analytic function Percentage Percentage difference from next value analytic function Percentage difference from previous value analytic function Permission levels for role-based access Permissions Pie Plotting routes Pointer color Prepare and use the dashboard Prepare source visuals Prepare target visuals Preparing Excel files for data import Previewing data table details Previous value analytic function Private workspace Projection opacity Promoting a user to administrator Province map, bubbles Province map, choropleth Public workspace Publishing Datasets Publishing datasets Python Admin API data format and response Quantity prefixes Quickstart Radial Rank analytic function RBAC Permissions RBAC setup for dataset publishing Real number Rearranging dashboards Rearranging tabs Receiving Parameters in Dashboards Refreshing a dataset Refreshing visuals manually Release Notes Remembering location of map Remembering node positions Remembering previous selections when searching Removing a dashboard from a tab Removing a tab from an application Removing a visual Removing default label Removing levels from the hierarchy Renaming a sheet Rendering visuals after filters in dashboards Reordering sheet IDs Reordering sheets Rerunning jobs Resetting dashboard style Resetting homepage to default Resizing images Restoring a Cloudera Data Visualization version Restricting columns in datasets based on SQL query Restricting Row-Level Access Restricting rows in datasets based on SQL query Result cache Retrieving or changing logging level Reverse color palette of visuals Reversing axis scale Reversing legend order Rich texts Role privileges Role-based access control Roles Routes and pins Row listing Row number function Running a data extract Running a SQL query Running total analytic function Same source and target data values Saving a table as a dataset based on the query Saving a table as a logical view Saving a table as a materialized table Saving derived data with full context Saving tables Scatter Schedule intervals Scheduled jobs Scientific Search Search bookmarks Search history Search results Search types Searching custom styles in dashboards Searching custom styles in visuals Searching site-wide custom styles Security Security and authentication Security model Segmenting data qualitatively Segments Segments Selected color Selected text color Selecting a range of dates on filter shelves Selecting a range of number values on filter shelves Selecting a string pattern for values on filter shelves Selecting all values Selecting discrete values on filter shelves Selecting end pin type Selecting map view Selecting middle pin type Selecting page orientation for PDF downloads Selecting page size for PDF downloads Selecting pin types Selecting start pin type Selecting values by using an expression on filter shelves Sending aggregates as parameters Sending parameters with dataset scope Separating histogram columns Separating trendlines by color September 30, 2021 Set up your data Setting a dashboard as homepage Setting app scope for filters Setting column label length Setting concurrency for a data connection Setting connection privileges Setting dataset privileges Setting dataset scope for filters Setting default homepage for all users Setting explicit scope for filters Setting filter associations Setting maximum row label length Setting minimum cell size Setting minimum trellis cell height Setting minimum trellis cell width Setting parameters through URL Setting role privileges Setting roles Setting segments Setting system privileges Setting the locale for CSV downloads Setting up a basic visual for aggregates Setting up a basic visual for single values Setting up a session Setting up dynamic external links Setting warning if query loads for too long Setting your homepage from a dashboard Setting your homepage with Set Homepage Sheets Shelves for AI visual Shelves for areas Shelves for bars Shelves for box plots Shelves for bullets Shelves for calendar heatmaps Shelves for chords Shelves for combos Shelves for correlation flows Shelves for correlation heatmaps Shelves for cross tabulation Shelves for dendrograms Shelves for external links Shelves for gauges Shelves for grouped bars Shelves for histograms Shelves for interactive maps Shelves for KPIs Shelves for lines Shelves for maps Shelves for networks Shelves for packed bubbles Shelves for pies Shelves for radials Shelves for row listing visuals Shelves for scatters Shelves for sparklines Shelves for tables Shelves for timelines Shelves for treemaps Shelves for word clouds Show borders on visuals in dashboards Showing a selection brush for ranges Showing adjacent duplicate values Showing autoplay transition animation Showing borders around visuals Showing column page totals Showing column totals Showing context menu Showing cross tabulation column totals Showing cross tabulation row totals Showing detail data button in context menu Showing dimension values on hovering Showing dimensions as marks Showing expansion totals above expansion rows Showing header column Showing header column borders Showing header for column page totals Showing header for column totals Showing heatmap legend Showing measure values inside bars Showing node labels Showing node labels Showing or hiding axis Showing or hiding axis labels Showing pagination Showing percentage Showing percentages as marks Showing points Showing row information Showing same source and target values Showing table data as HTML Showing the same source and destination values Showing usage information Site configuration Site Settings Sorting custom styles in dashboards Sorting custom styles in visuals Sorting site-wide custom styles Sparklines Specifying a custom icon Specifying a group for a dataset Specifying atlas mapbox server for visual Specifying choropleth layer ID Specifying choropleth opacity Specifying default aggregation field for a dataset Specifying fields for a dataset Specifying font weight for totals column in cross tabulation Specifying font weight for totals row in cross tabulation Specifying geographic fields Specifying label for percentage Specifying mapbox key for visual Specifying maximum number of columns Specifying number of rows per page Specifying qualitative range as percentages Specifying suggested questions for dataset Specifying synonyms for a dataset Specifying totals column font weight Specifying word substitutions for a dataset SQL SQL for first table SQL queries Stacked bars Standard format specifier Starting aggregate scale at zero State map, bubbles State map, choropleth Static Assets Staying at same map location STRUCT data type Supported connections Supported metastores Supported visual artifacts Syntax for using parameters Table Table and cross tabulation colors Table styles Table styles Tables Terms for aggregation Terms for basic filters Terms for comparing data points Terms for dimension field matching Terms for ranking Terms for sorting Terms for time series Terms for visual types Text color Ticks font size in a visual Timeline Tokenizing input Tooltip Tooltip font family in dashboards Tooltip font size in dashboards Tooltips Tooltips in dashboards Top Tasks Tracking dataset versions [Technical Preview] Treemap Trellis Trellis font size in a visual Trellis on dimensions Trellis on measures Trellised radial Trellised visuals Trellised word clouds Understand the UI Unlinking visuals Unlocking account Upgrading Cloudera Data Visualization Upgrading Cloudera Data Visualization Uppercase URL Aliases Usage Analytics [Technical Preview] User impersonation in Cloudera Data Warehouse User interface Users Users and User Groups Using Advanced Visualization Techniques Using alias Using alphabetic values Using Analytic Functions Using analytic functions - basic steps Using API keys Using Cloudera Data Visualization in air-gapped Cloudera Data Science Workbench deployment Using Cloudera Data Visualization in Cloudera AI Using Cloudera Data Visualization in Cloudera Data Science Workbench Using Cloudera Data Visualization in Cloudera Data Warehouse Using context menu options Using custom display configurations Using custom display formats for large numbers Using Data Discovery and Visualization Using derived data Using filter labels inline Using Filter Widgets on Dashboards Using fixed dates mode Using LDAPS Using multi-select mode Using Natural Language Search Using parameters with explicit scope Using quick filters Using relative dates mode Using same color for main indicator as arrow Using Search in embedded mode Using secondary axis Using segments in visuals Using single value mode with radio buttons Using single value with dropdown menu Using sparklines Using the search visual in a dashboard Using trellis option with areas Using trellis option with independent scale Verifying access restriction on a visual Version control Viewing an existing asset Viewing derived data definitions Viewing field comments in Visual Builder Visual axes and labels Visual axes and labels styles in dashboards Visual basic background color in dashboards Visual basic font family in dashboards Visual basic font size in dashboards Visual basics Visual basics styles in dashboards Visual border styles in dashboards Visual Builder Visual color palette Visual label font size in dashboards Visual label title text color in dashboards Visual legend font size in dashboards Visual subtitle alignment in dashboards Visual subtitle background color in dashboards Visual subtitle font family in dashboards Visual subtitle font size in dashboards Visual subtitle text color in dashboards Visual subtitles Visual subtitles styles in dashboard Visual title alignment in dashboards Visual title background color in dashboards Visual title font family in dashboards Visual title font size in dashboards Visual title font weight in dashboards Visual title text color in dashboards Visual titles Visual titles styles in dashboard Visual trellis font size in dashboards Visual type catalog Visuals Visuals Visuals Visuals Visuals for analytics Visuals with optional dimensions Visuals with optional measures Visuals with variable dimensions Visuals with variable measures WebServer Log WebServer Stats What is a dashboard? What is a visual? What is an application? What's new Word cloud Working with Data Working with data extracts Working with data models Working with data profiling Working with datasets Working with Derived Data Working with Dimension Hierarchies Working with dimension hierarchies Working with Events Working with Legends in Visuals Working with search visuals Working with Segments Working with User Roles Workspaces Workspaces Workspaces Workspaces Wrapping column contents Zipcode map, bubbles Zoom
Changing number of decimals for percentage
On the right side of Visual Designer , click the
Settings menu. 
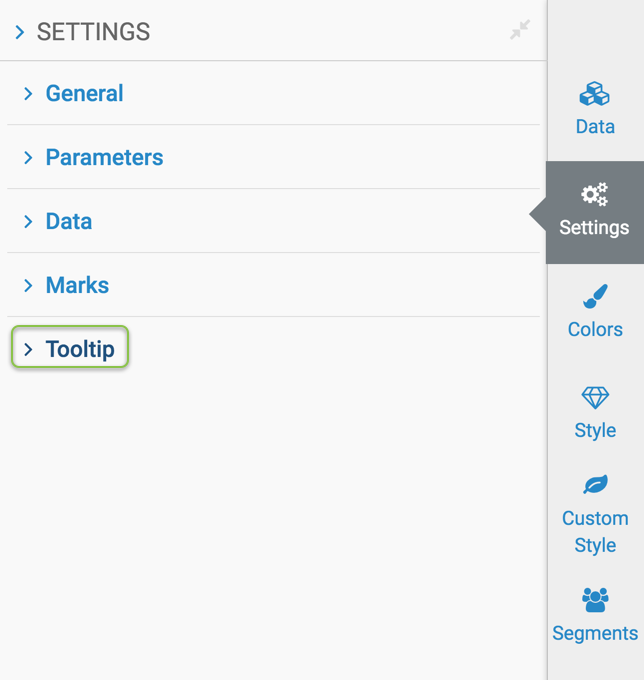
In the Settings menu, click
Tooltip . To change the number of decimal places in the percentage measurement for a tooltip
of a visual, adjust the selector for the Decimals included in
percentage option. The default value is 2.