
Creating dataset filters on a dashboard
Cloudera Data Visualization enables you to add a filter widget to the dashboard based on any field in the dataset.
-
Click any field of the dataset from Dimensions or
Measures to add a widget to the dashboard that filters on that
field.
Alternatively, you can also drag the field that you want to use as a filter and drop it into the filter bar on the dashboard.A new filter widget is added in the filter area of the dashboard, named after the field you have used. You can hover over the widget to access filter actions in the top-right corner.
- Clicking the
 icon moves the filter to the grid area.
 - Clicking
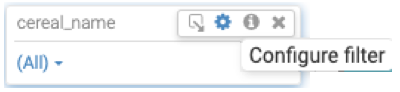
 opens the Settings modal window
that allows you to configure the filter.
opens the Settings modal window
that allows you to configure the filter. - Hovering over the Info icon displays the filter's information modal, providing information about the visual and the dataset.
- Clicking the
 icon removes the filter from the
dashboard.
icon removes the filter from the
dashboard.
- Clicking the
-
To set the basic configuration for the new dashboard filter, click in
the top right corner.
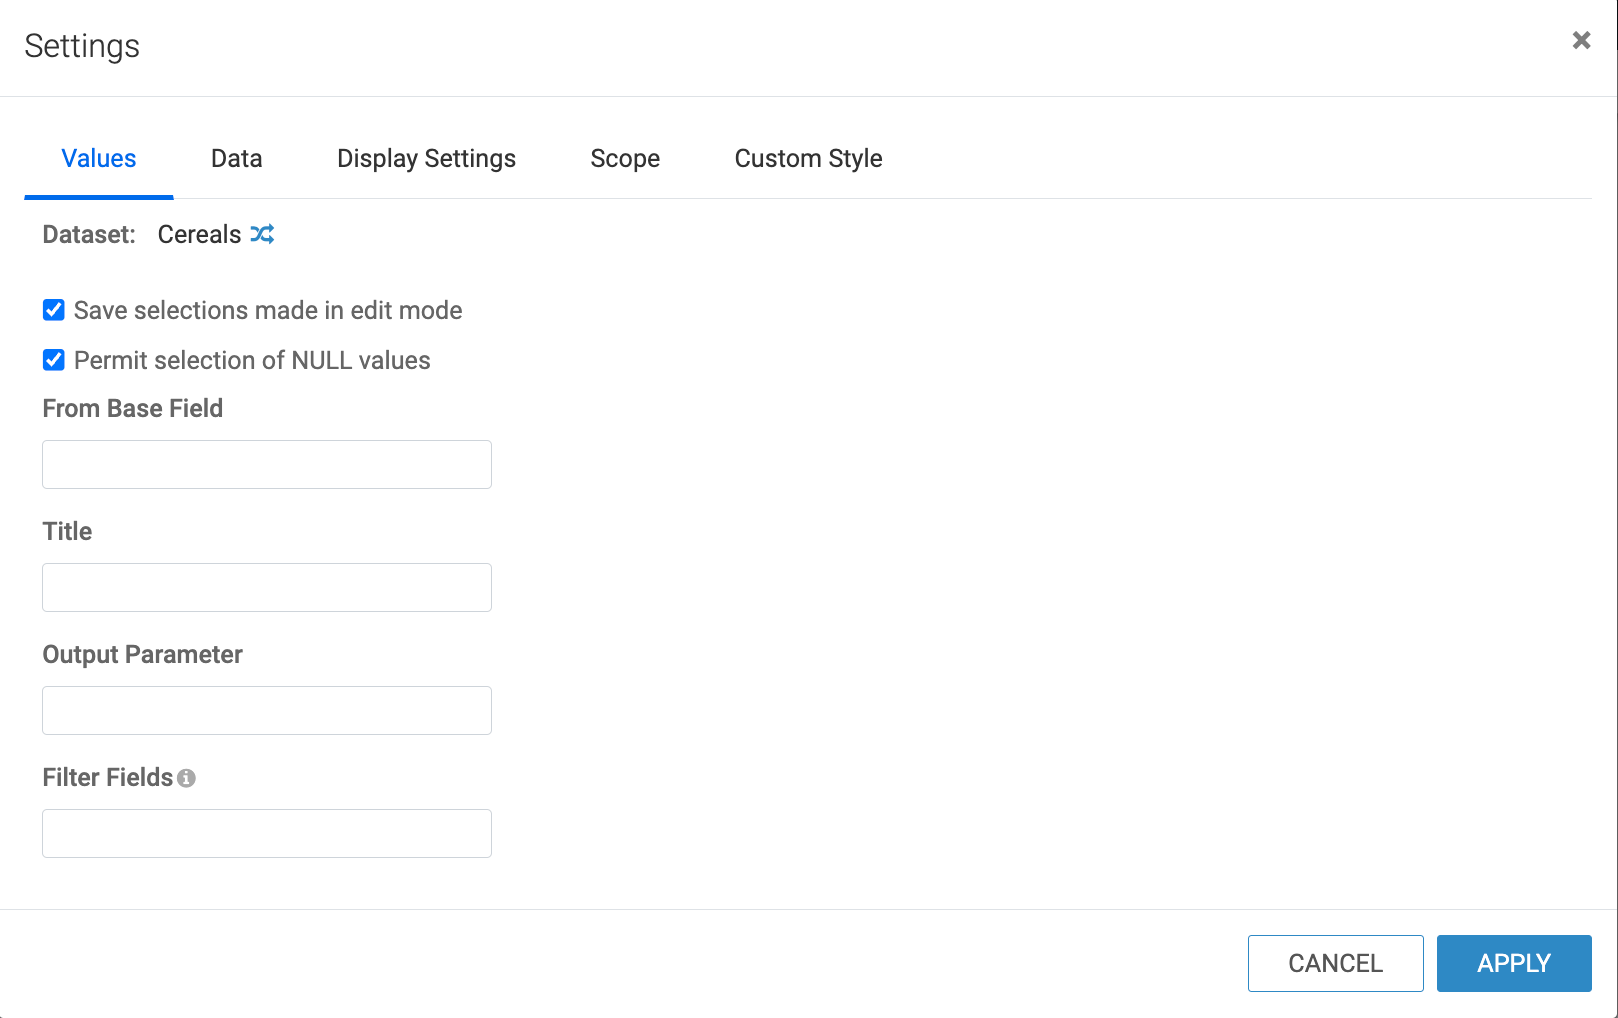
The Settings modal window opens on the Values tab, showing the dataset of the filter and several configuration options.
-
To switch the filter to another dataset and connection, click
 .
.
-
To switch the filter to another dataset and connection, click
For more information on further configuration options, see the following documentation.
