Percentage display format
Cloudera Data Visualization enables you to specify percentage format for a numerical field.
The following steps demonstrate how to properly use percentages, the % format option, with display format.
- Click the field you plan to modify, to open the Field Properties menu.
- Under Field Properties, click Display Format.
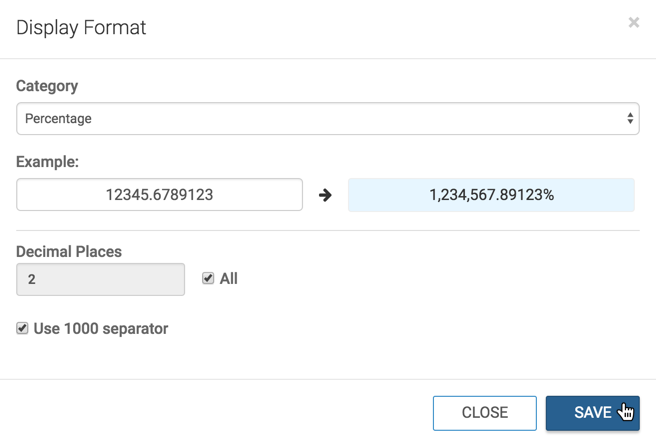
- In the Display Format interface, select Percentage from the Category menu.
- Make adjustments as needed:
- Under Decimal Places, change the number of decimals.
- To show no decimals, clear the Decimal Places text box.
- To show all decimals, select the All option.
- Select the Use 1000 separator option.
-
Click SAVE.

- Click REFRESH VISUAL.
Percentage Display with Cereals Dataset🔗
Here, we are using a basic table visual built in the Cereals dataset.
-
Start a Table visual on the Cereals dataset.
-
Populate the shelves from the available fields (Dimensions, Measures, and so on) in the Data menu.
- Place
cereal_nameon the Dimensions shelf. - Place
calories,protein_grams,fat_grams,dietary_fiber_grams,complex carbohydrates_grams,sugars_grams, andsodium_mgon the Measures shelf.
- Place
-
[Optional] Use Alias to rename the fields on the shelf to % Daily Calories, % Daily Protein, and so on.
-
Ensure that the aggregation function used by the measure is Average, for calculations in the next step. See Aggregates.
-
To calculate the percentage of daily recommended intake that a portion of each cereal represents, edit the expression of each field to divide by daily values.
Table 1. Daily Intake Recommendations Calories Protein Fats Fiber Carbohydrates Sugar Sodium 2000 cal 50 grams 70 grams 30 grams 310 grams 90 grams 2300 milligrams -
Set the display format for the re-calculated fields.
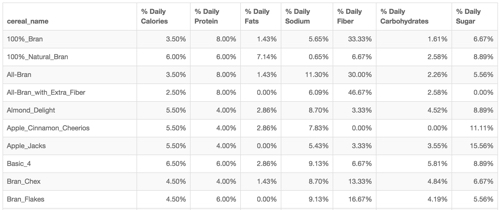
For all the fields on the Measures shelf, change the Display Format to Percentage, select a 2- decimal display, and click SAVE.
-
Click REFRESH VISUAL.
Note that the visual's display has the specified format, the % sign, and 2 decimal places.


