Specifying the bucket count
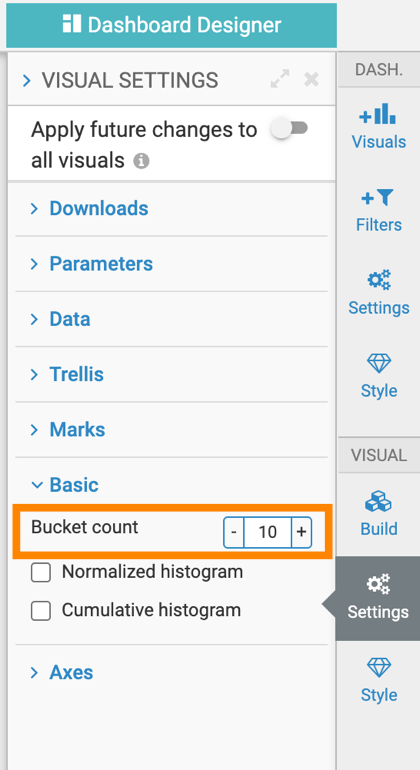
The default histogram displays data in 10 buckets. You can easily adjust this setting to control the granularity of your data display.
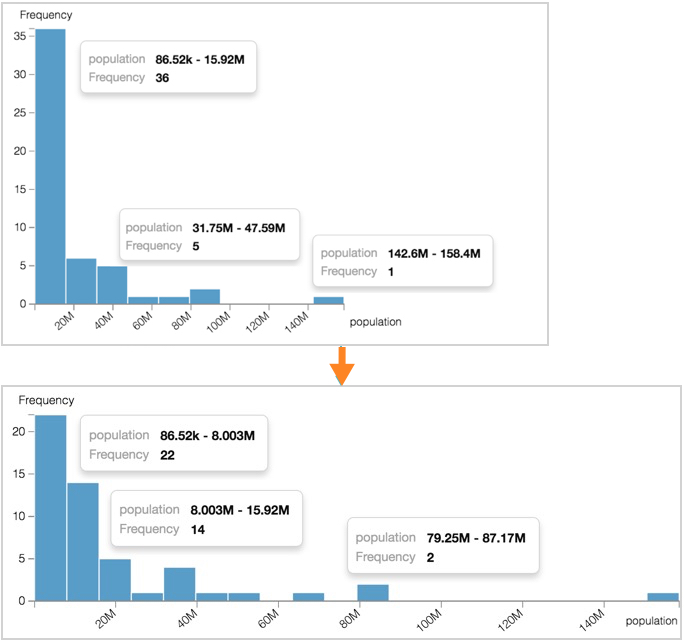
Increasing the bucket count results in narrower buckets, meaning each bucket represents a smaller range of values. This can provide a more detailed view of the data distribution. Conversely, reducing the bucket count widens each bucket, simplifying the visualization and giving a broader overview.
The following example shows a histogram with 10 buckets compared to a histogram with 20 buckets. You can see how doubling the number of buckets reduces the range of values in each bucket by half, providing a more granular look at data distribution.


