Interactive map with multiple measures

CDP Data Visualization enables you to display multiple measures in Interactive Map visuals.

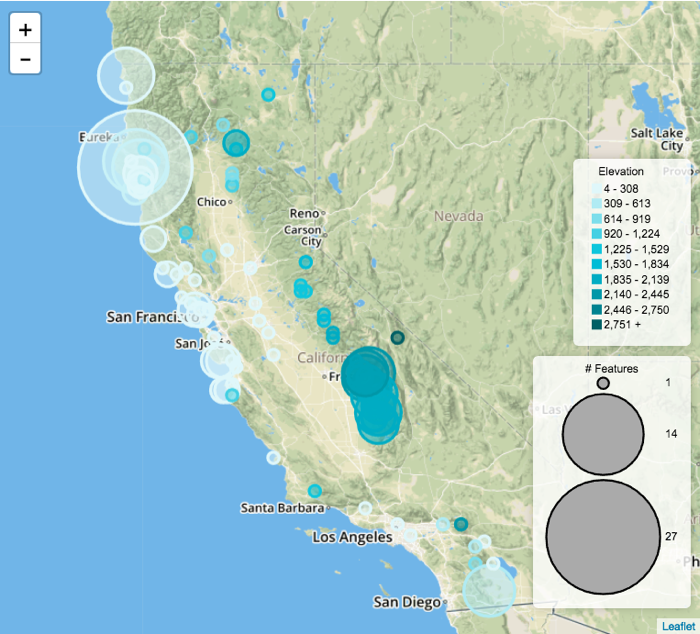
You can display two distinct measurements in the Circle Layer by placing the secondary measurement on the Colors shelf. The following steps extend the work completed in Interactive maps, and demonstrate how to visualize two separate measures on the same map.

  1. Clone the California Woods visual, previously built in Interactive maps.
    For instructions, see Cloning visuals.
  2. Select another measurement to add to the visual, and add it to the Colors shelf.

    In this example, elev_in_m is selected, the aggregation function is changed to max(elev_in_m), and the Elevation alias has been applied

  3. In the Settings menu, turn off Heatmap, Cluster, and Routes.
  4. In the Settings menu, enable Circles, and turn on both the Area legend and the Color legend options.
  5. Click REFRESH VISUAL to see two measures on the same map.
  6. Click the pencil/edit icon next to the title of the visualization to enter a name for the visual.

    In this example, the title is changed to 'California Woods - Two Dimensions'. You can also add a brief description of the visual as a subtitle below the title of the visualization.

  7. At the top left corner of the Dashboard Designer, click SAVE.