In an Interactive Map visual, Cloudera Data Visualization enables you to
create choropleth maps. A choropleth map shows geographical areas that are shaded in
proportion to the value of the measurement that is displayed on the map.
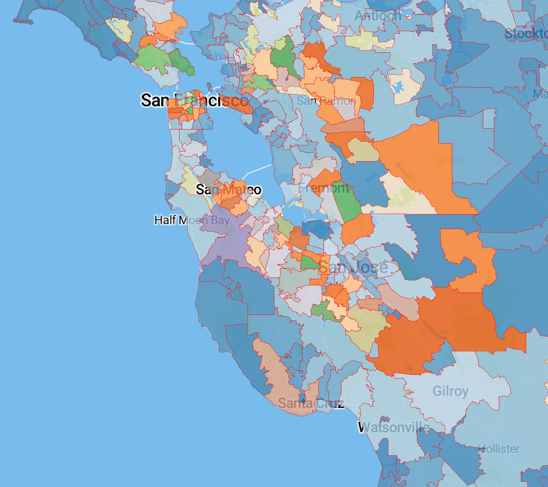
In this example, you will create a choropleth map that colors the average tax
liability in California by zip code. The choropleth Interactive Map visual
is based on the Personal Income Tax Statistics by Zip Code dataset.
For an overview of shelves that specify this visual, see Shelves for
interactive maps.
To create a choropleth map, you must specify the following for each visual:
Custom mapbox style, which has a choropleth shape
file in it. For more information, see Adding a custom mapbox
style.
Layer ID, which is the name of a unique layer
within the Custom Mapbox style that identifies
the shapes that you would like to color by a measure in your data. For
more information, see Specifying a choropleth layeer
ID.
Geo-type as Shape ID: The dataset must
have at least one field in the Geo shelf to
determine the location on the map. You must change the Geo-type to
Shape ID. A Shape
ID is a key that joins the shapes in the
Custom mapbox style and the field in the
Cloudera Data Visualization dataset. This helps in
identifying the measure that maps to the shape. This Geo field must be
in the dataset that was used to create the custom mapbox style.
Start a new visual based on the National Geographic Features
dataset.
For instructions, see Creating a visual.
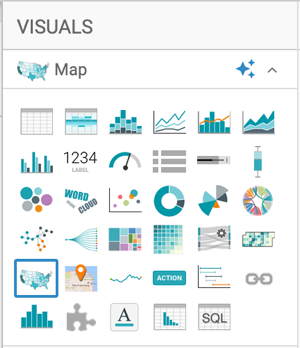
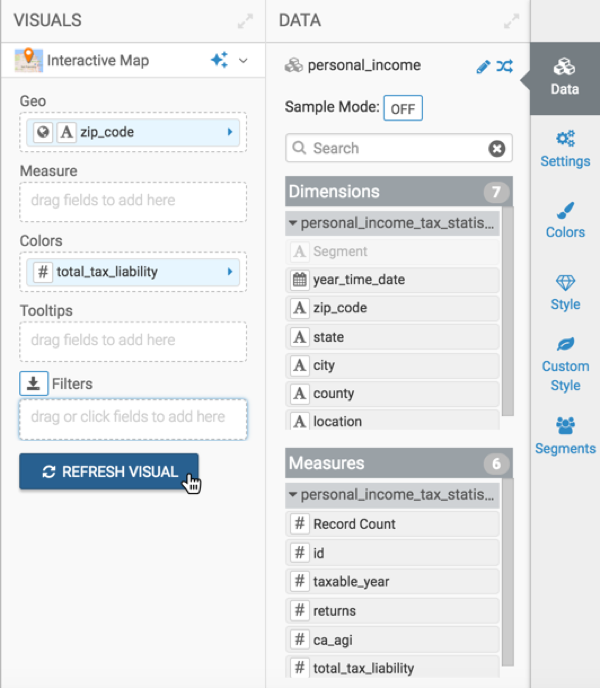
In the VISUALS menu, find and click
Interactive Map.
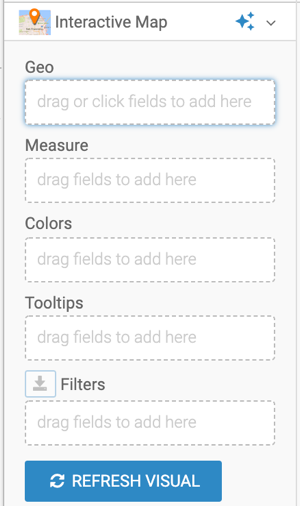
The shelves of the visual changed. They are now
Geo, Measure,
Colors, Tooltips,
and Filters. The only mandatory shelf for map
visuals is Geo.
Populate the shelves from the available fields in
Dimensions and
Measures in the
DATA menu.
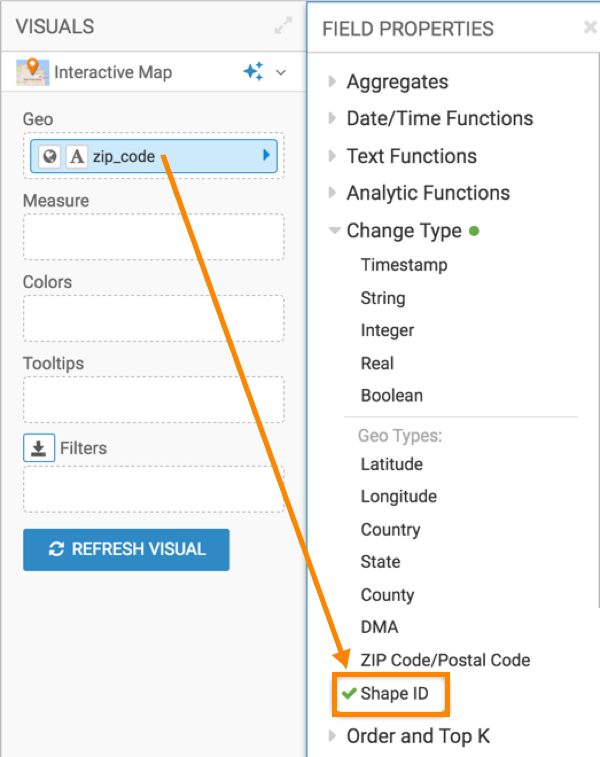
Select the zip_code field and drag it to
the Geo shelf to identify the
shapes by zip code.
Cast this to the appropriate Geo Type: click the field on
the shelf, and in the Field
Properties menu, select
Change Type, and select
Shape ID. This helps in
identifying the measure that maps to the shape.
Under Measures, select the
avg(total_tax_liability) field, and
drag it to the Colors shelf.
Change the aggregation from
total_tax_liability, by selecting
Aggregates Average
This colors the average tax liability in California by zip
code.
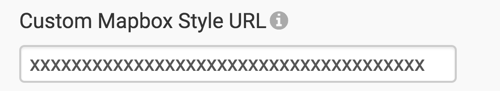
Navigate to the Map Style menu under
Settings, and enter a Custom
mapbox style that you have obtained from Mapbox.
Make sure that this style has a choropleth shape file in it.
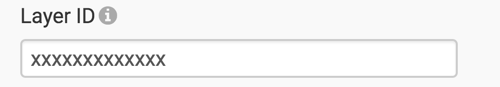
Navigate to the Choropleth menu under
Settings, and enter a Layer
ID.
Choropleth Layer ID identifies the shapes that
you would like to color by a measure in your data.
Click REFRESH VISUAL.
The choropleth map visual appears.
If the visual does not display a choropleth map, check that the
Geo-type of the zip_code field is set to
Shape ID.
Proceed to Customizing the choropleth map.
This site uses cookies and related technologies, as described in our privacy policy, for purposes that may include site operation, analytics, enhanced user experience, or advertising. You may choose to consent to our use of these technologies, or