Cloudera Data Visualization allows you to create Timeline visuals. Timelines are
graphical representations of activities/events displayed against time.
In a Timeline visual, each activity/event is represented by a bar of a time period along a
suitable time scale. You need two different timestamps to define the projection of the time
period. The starting point of the bar reflects the start date, the end point reflects the
end date, and the length of the bar corresponds to the duration of the activity.
The following steps demonstrate how to create a Timeline visual based on the Earthquake
Data January 2019 dataset. You can create simple linear representations or more
complex visualizations. For an overview of the shelves that specify this visual, see
Shelves for Timelines.
Start a new visual based on the Earthquake Data January 2019 dataset.
For instructions, see Creating a visual.
By default, a table visual is
displayed that shows all fields in the dataset.
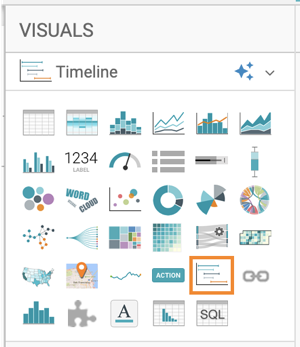
In the VISUALS menu, find and click the
Timeline icon.
The shelves of the visual change.
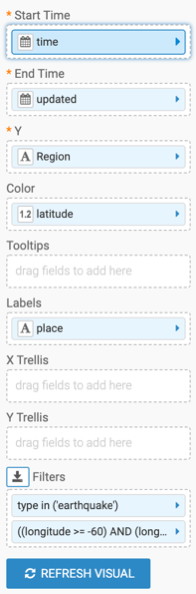
Populate the shelves from the available fields (Dimensions and
Measures) in the DATA menu.
Make the following selections to recreate the example Timeline visual:
Add ‘time’ to the Start Time shelf.
Add ‘updated’ to the End Time shelf.
Add ‘Region’ to the Y axis.
Add ‘latitude’ to the Color shelf.
Specify ‘place’ as a label on the Labels
shelf.
Define a filter for ‘type’. Select ‘earthquake’.
Define a filter for ‘longitude’. Only include earthquakes between -60° and
0°.
For further information about the shelves of the visual, see Shelves for
Timelines.
Click REFRESH VISUAL.
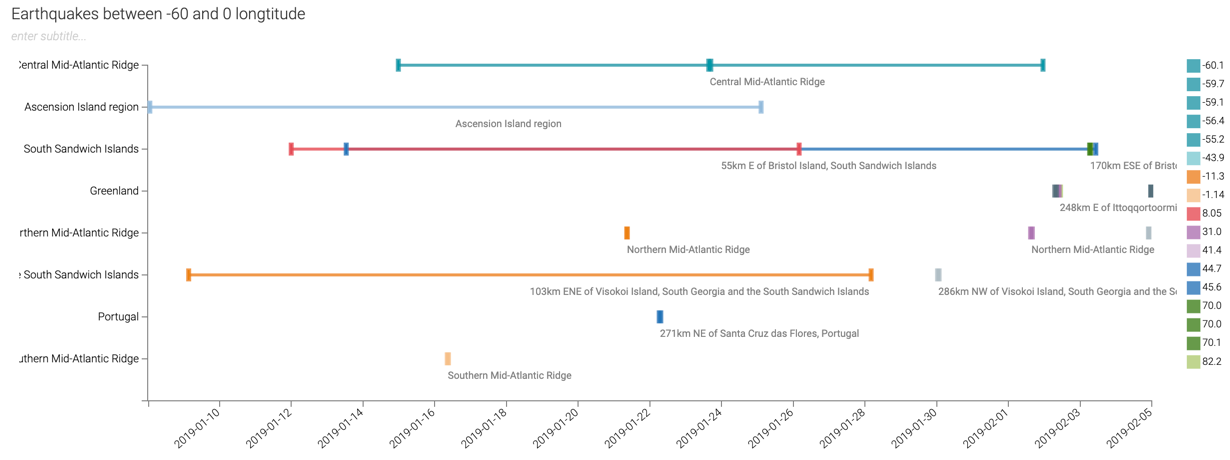
The updated Timeline visual appears.
Legend is on by default, and it appears on the
right side of the visuals. If you want to change the legend style or remove it from the
visual, see Adding and removing legend.
Add the title Earthquakes between -60 and 0 longtitude.
At the top left corner of the Dashboard Builder, click
SAVE.
Your visual should look like the following:
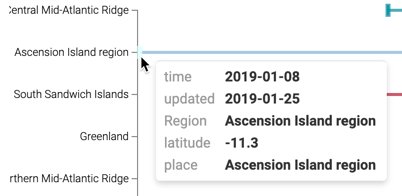
Details of a particular timeline are shown in tooltips if you hoove over:
We want your opinion
How can we improve this page?
What kind of feedback do you have?
This site uses cookies and related technologies, as described in our privacy policy, for purposes that may include site operation, analytics, enhanced user experience, or advertising. You may choose to consent to our use of these technologies, or