Using the cumulative option
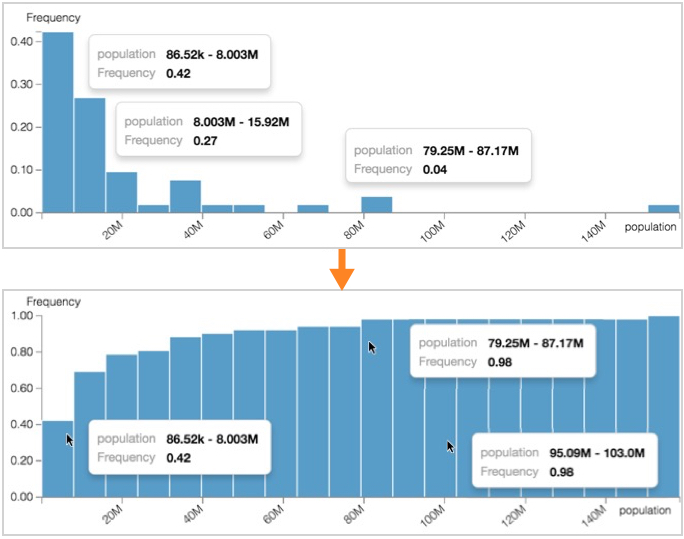
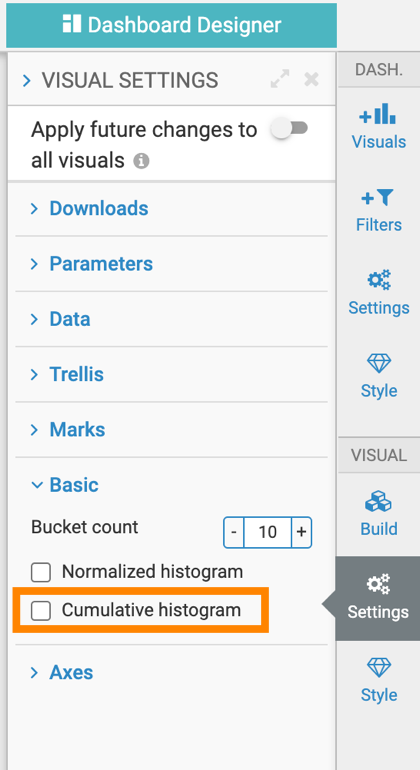
By default, a histogram displays the count or frequency for each bucket individually. Enabling the cumulative option adjusts the histogram so that each bucket's count or frequency is added to the previous total. As a result, the right-most bucket shows the total count or 1 (100%) if the histogram is normalized.
The following image shows the difference in the vertical axes. In the lower image, the cumulative values build up towards 1 (or 100%) on the right side of the graph, reflecting the running total.


