ARRAY data type
This article describes the specifics of the ARRAY complex data
type.
Syntax for ARRAY
column_name ARRAY < type >
type ::= primitive_type | complex_type
ARRAY data types represent collections with arbitrary numbers of
elements, where each element is the same type. An ARRAY type is
like a miniature table, with two columns:
- POS
-
Position of element in the array
Access as
array_name.pos - ITEM
-
Value of array element that may be a scalar, or another complex type (another
ARRAY, aSTRUCT, or aMAP)Access as
array_name.itemIf an array contains a
STRUCT, access asarray_name.item.field_name, or asarray_name.field_name
Arrays in the Dataset Field interface
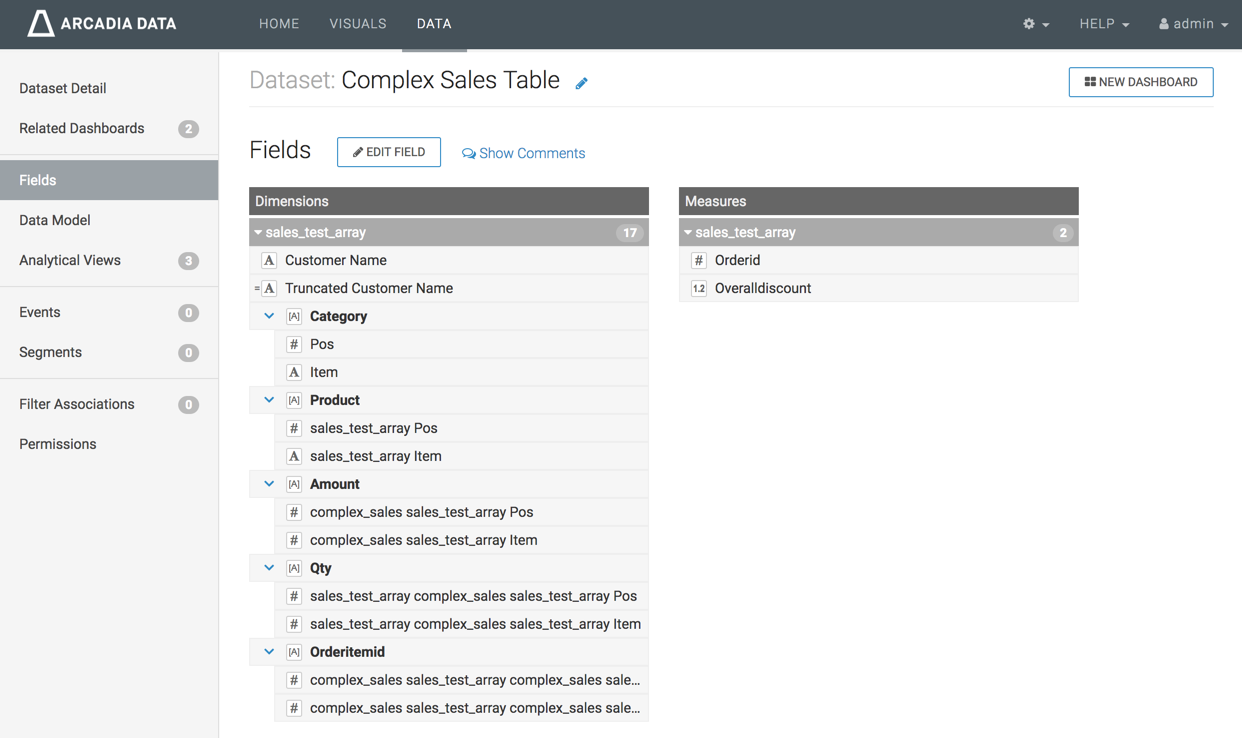
In the Dataset Fields interface, an example of a basic
ARRAY data type may look like the following example. You can
see that each level of a complex data type may be expanded to show component
details, or collapsed for simplicity.

In the example of the dataset Complex Sales Table, you can see that the
Dimensions
Customer Name and the derived Truncated Customer Name are primitive
types (both are Strings, marked with the symbol A), along with the
Measures
Orderid (Integer, marked with the symbol #) and
Overalldiscount (Real, marked with the symbol 1.2).
However, the Dimensions
Category, Product, Amount, Qty and Orderitemid
are all Array data types, symbolized by [A].
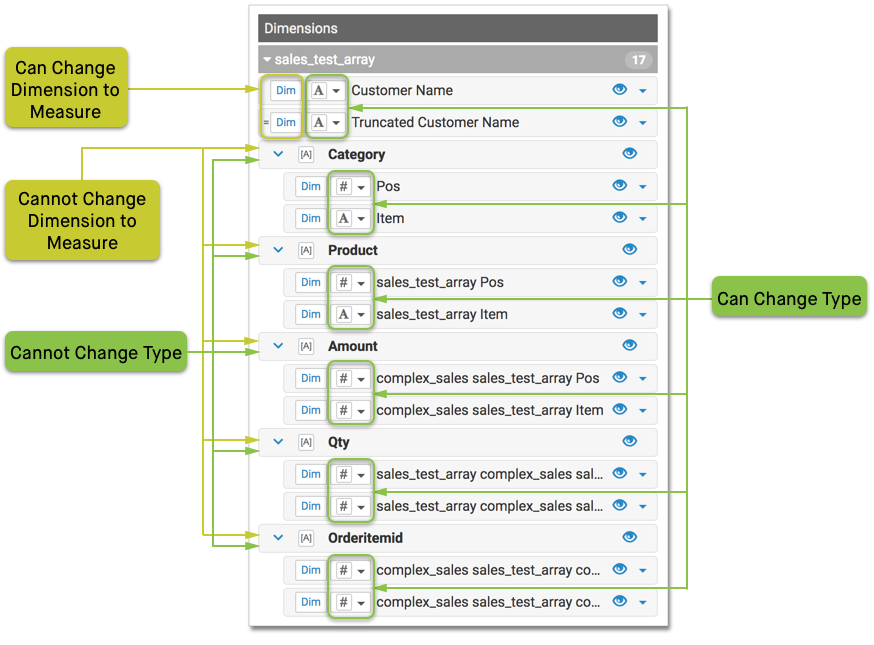
When you click Edit Fields, you can see that while primitive types can be cast as alternate data types (such as Integer into Real), the complex data type Array cannot be changed to another type. However, the primitive components of the array may be cast as other primitive data types. Additionally, unlike other data types, Cloudera Data Visualization uses complex datatypes only as Dimensions. They or their components cannot be redefined as Measurements of the dataset.

Arrays in visuals
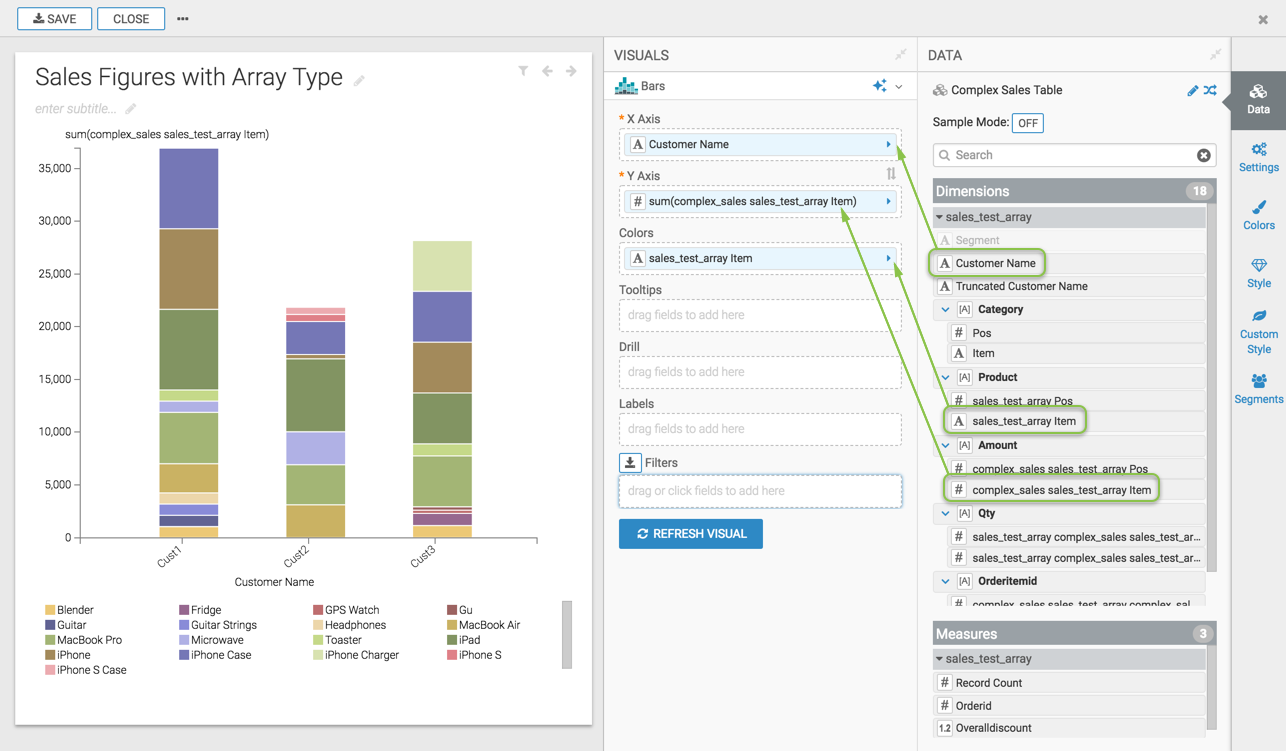
When building a visual with complex data, you cannot use the complex type directly, as a whole. However, you can add the primitive components of the complex type to the shelves of the visual.
For example, in a Bars visual you might place Customer Name on the X Axis shelf, the Amount:Item component on the Y Axis shelf, and grouped on the Colors shelf by Product:Item component.

Changing field properties
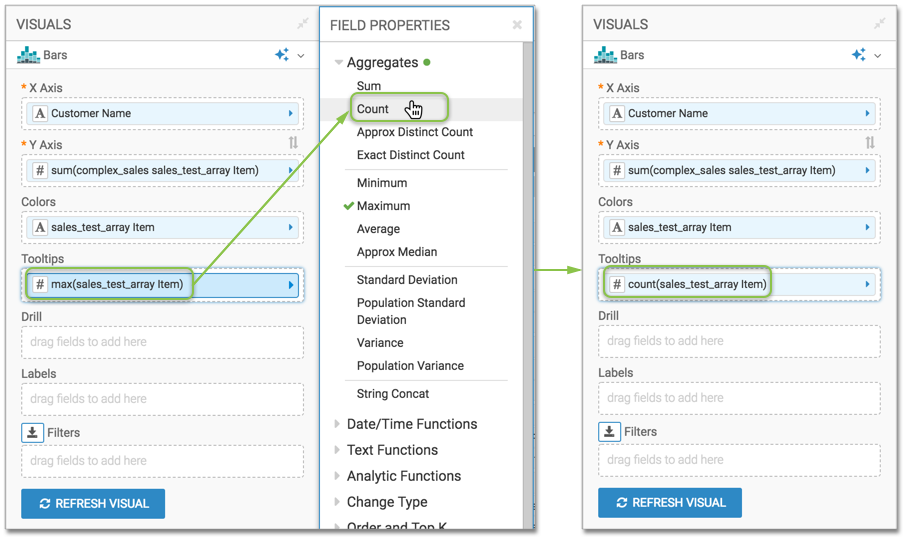
It is very simple to change field properties for a component of a complex data type.
For example, you can change the Product:Item component on the
Tooltips shelf from the default max()
aggregation to the count() function.

Arrays in Expression Editor
The expression editor fully supports the use of Arrays, both in the
Dataset and the Visual interfaces.
This enables advanced data manipulation and customization, leveraging the
capabilities of ARRAY data type in your data visualization
tasks.


