
Creating date/time filters on a dashboard
In Cloudera Data Visualization, date and timestamp filters are essential for dynamically adjusting your dashboard visuals based on time-related data. By using date/time filters, you can allow users to easily explore and analyze records filtered by specific dates or time ranges. These instructions walk you through the process of creating and configuring date/time filters on a dashboard, including basic settings, time range selection, and customization options. You will learn how to add filters, adjust their configurations, and optimize them for a more tailored user experience.
-
Click any date type field from the dataset under Dimensions or
Measures.
You can see a new date/time filter widget added to the dashboard named after the selected field. You can hover over the widget to access filter actions in the top-right corner.
- Clicking the Move icon moves the filter to the grid area.
- Clicking
 opens the Settings modal window
that allows you to configure the filter.
opens the Settings modal window
that allows you to configure the filter. - Hovering over the Info icon displays the filter's information modal, providing information about the visual and the dataset.
- Clicking the Cross icon removes the filter from the dashboard.
For instructions on how to configure date ranges, see Configuring ranges on dashboard filters.
-
To set basic configuration for the new dashboard filter, hover over the filter widget
and click in the top right corner.
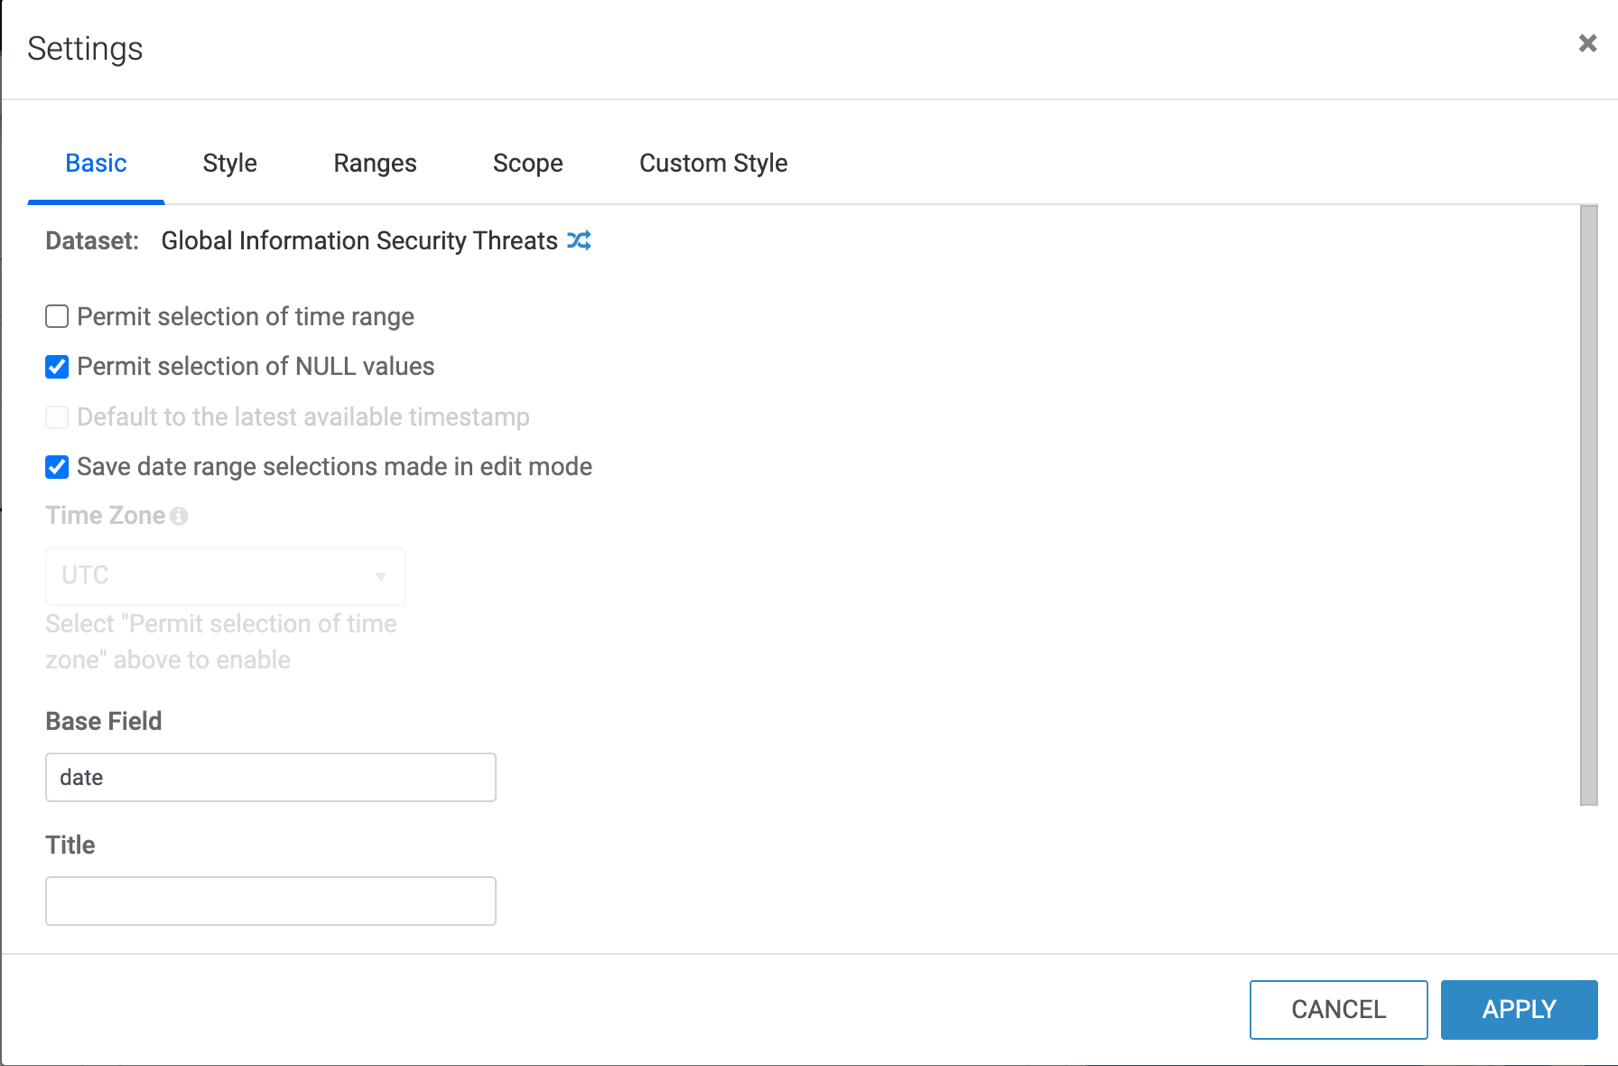
The Settings modal window opens on the Basic tab, showing the dataset of the filter and several configuration options.
-
You can switch the filter to another dataset and connection by clicking
 .
.
-
You can switch the filter to another dataset and connection by clicking
For more information on further configuration options, see the following documentation.
