Trellised radial
In Radial visuals, Cloudera Data Visualization enables you to add trellises for comparing and contrasting data.
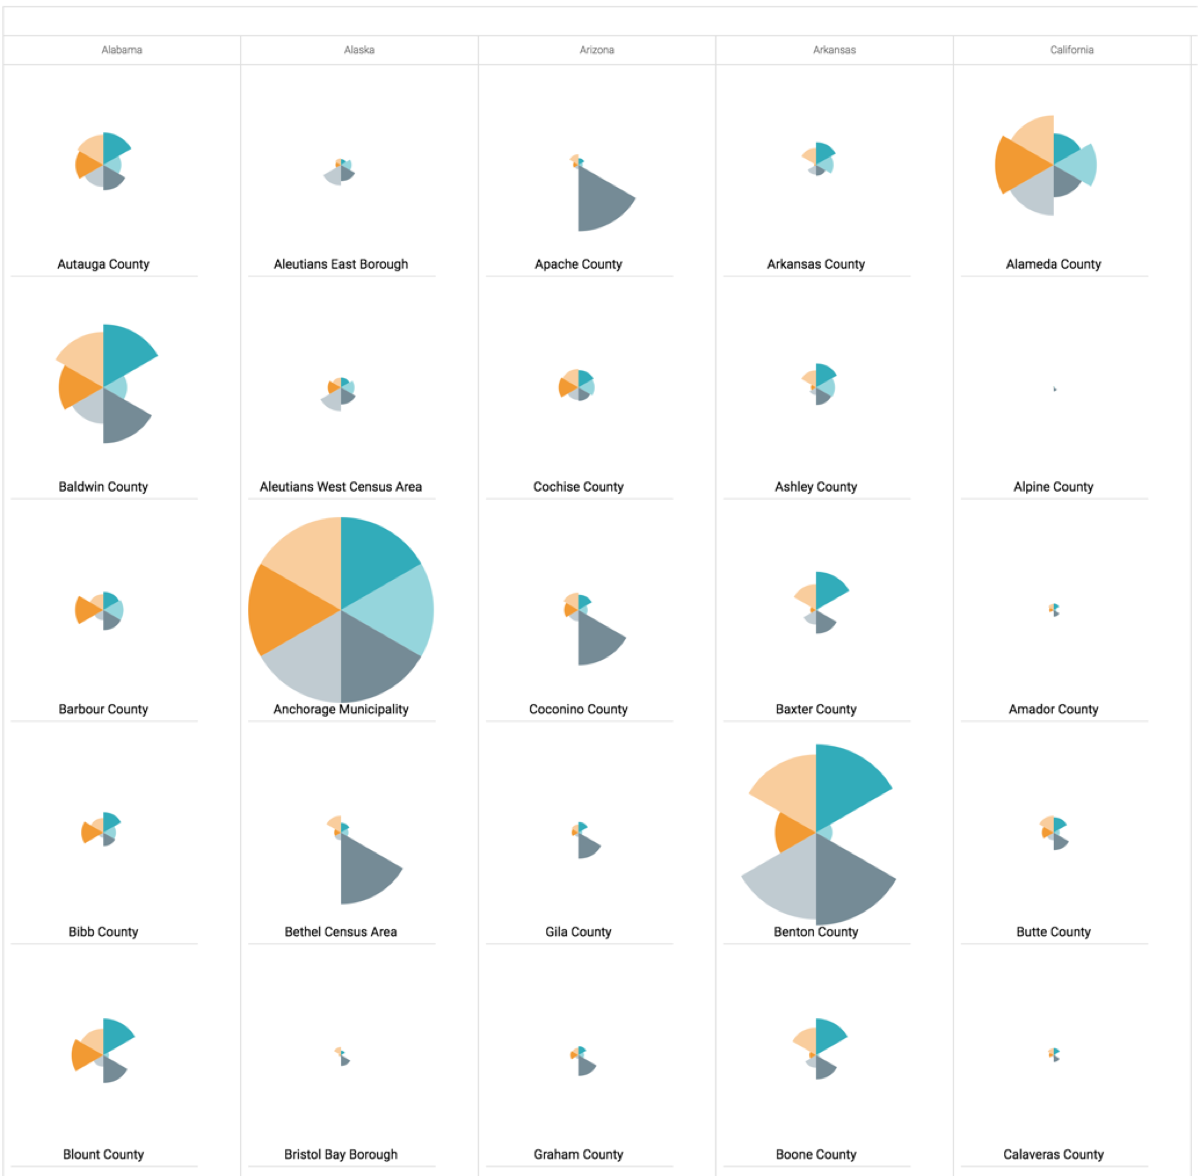
In the following example in the US County Population dataset, the field
stname (aliased as State) is used as a trellising
partition. Placed on the X Trellis shelf , it creates a trellised
version of a radial visual you developed in Radials.
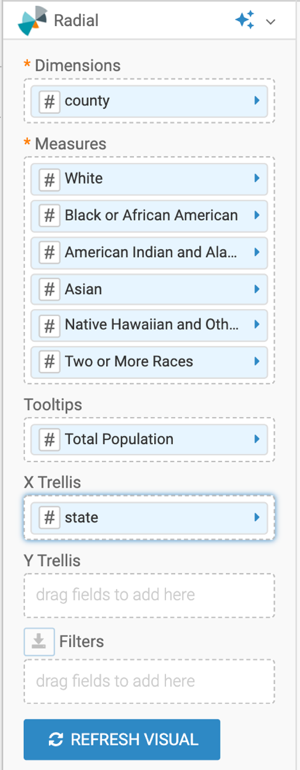
This is the shelves set-up for the trellised visual:
The trellising organizes the individual radial charts into columns, by State. Within each column, the charts appear by alphabetical name of the County.