Showing column totals
In Cloudera Data Visualization, you can add table and queries visuals report values in rows by default. But there is an option of adding a totals row to a table and use it to present column totals.
-
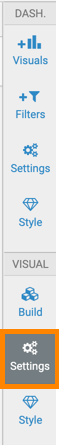
On the right side of Visual Designer, click
Settings in the VISUAL section of the
menu.
-
Open the Data Summary menu and select the Show
totals option.

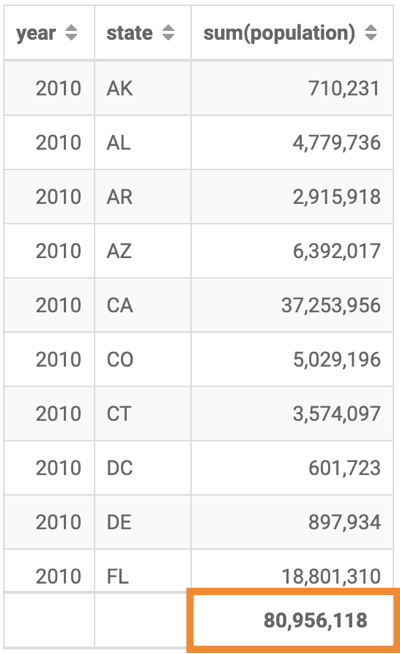
In this table, you can see the totals reported for numerical measurement columns: