Usage Analytics [Technical Preview]
Logs and Usage is a monitoring interface that helps you understand how users interact with Cloudera Data Visualization in your organization. It provides access to raw log files that you can download in their original format, packaged as a ZIP archive for easier troubleshooting and sharing. The interface includes multiple tabs that present detailed information about user activities, system load, and runtime performance.
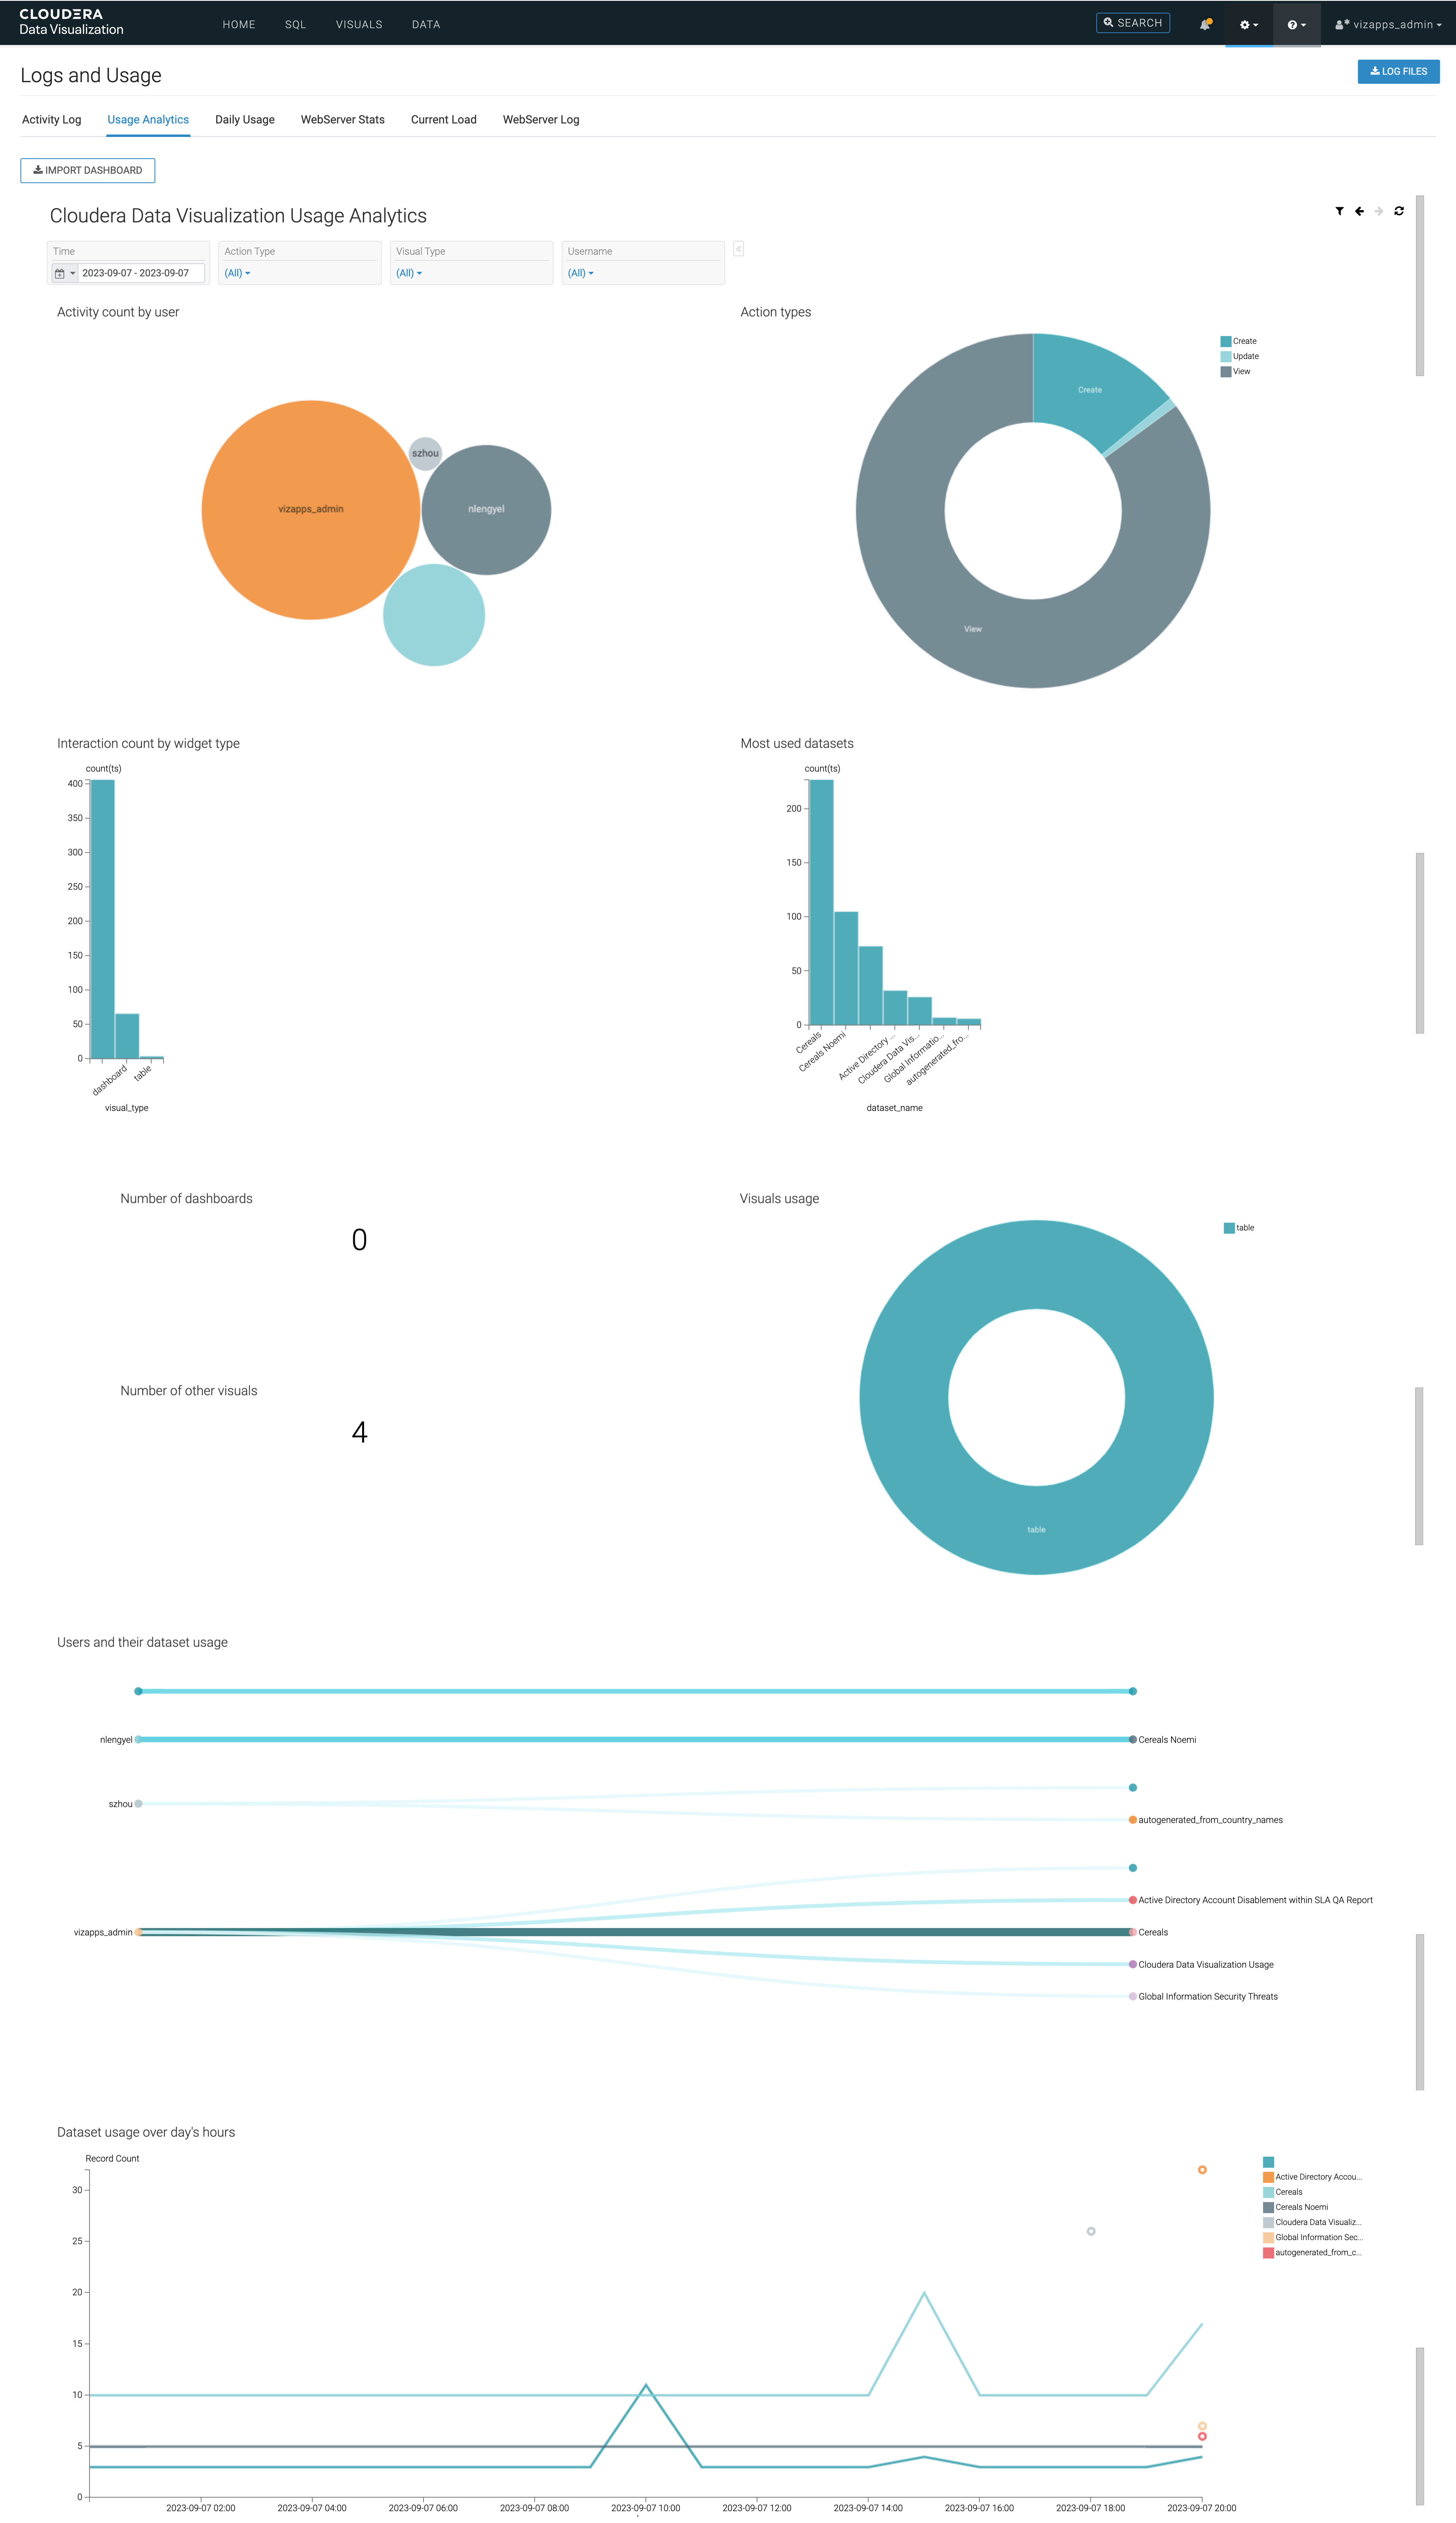
The Usage Analytics tab of the interface provides a dynamic dashboard with pre-built visualizations generated from the audit logs available on the Activity Log tab. It helps you gain insights into how users interact with Cloudera Data Visualization, including the most active users, frequently used datasets and visual types, peak activity hours, and other key operational metrics.
You can access it from .
The dashboard offers a time range selector that enables you to specify the data used for the visualization. Filters are available for action type, visual type, and username to refine the data displayed.
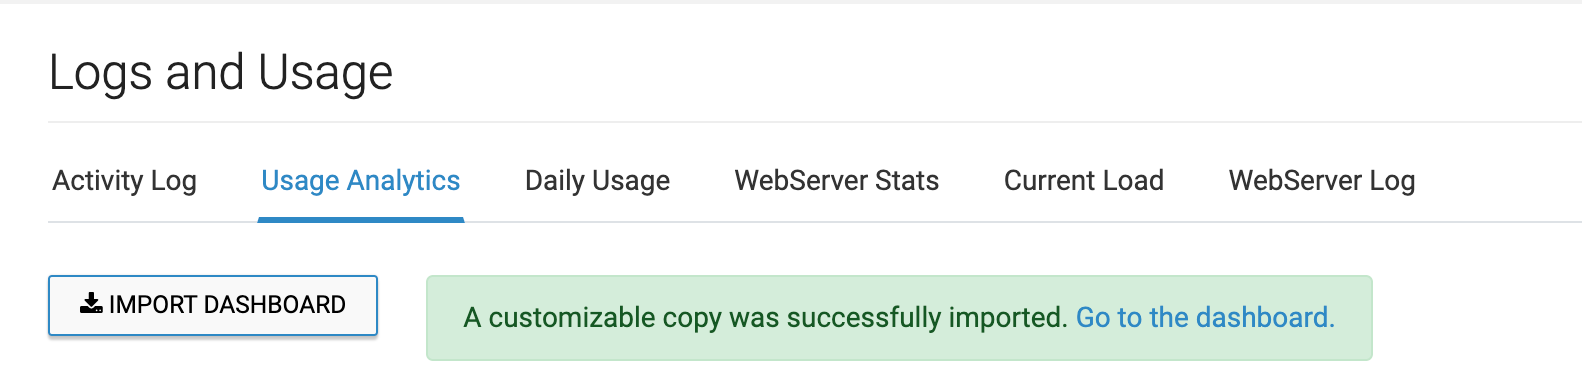
The Usage Analytics view is further customizable. You can click IMPORT DASHBOARD to add an editable version labeled Cloudera Data Visualization Usage Analytics to your collection of dashboards.
By default, the Usage Analytics dashboard includes the following visualizations:
-
Activity count by user: Tracks user activity and provides insights into user engagement.
-
Action types: Displays a breakdown of various action types, helping you understand user interactions.
-
Interaction count by widget type: Provides insights into widget interactions and usage.
-
Most used datasets: Highlights frequently accessed datasets.
-
Number of dashboards: Shows the count of dashboards in use.
-
Visuals usage: Offers insights into the usage of visual components.
-
Number of other visuals: Indicates the usage count of other types of visuals.
-
Users and their dataset usage: Provides information about users and their dataset usage patterns.
-
Dataset usage over day's hours: Shows dataset usage trends throughout the day.