Derived data
Derived data lets you to reference results in new queries, query stacking, and eases cohort analysis. Cloudera Data Visualization uses derived data for computed fields in data modeling, weighted sums and averages, custom binning, for set-based and group-based analysis, and for combining data from different data sources.
Derived data enables you to reference query results in new queries, in essence "stacking" results from sub-select queries. The derived data feature also supports cohort analysis, where a set of data from a report is used (joined back) in another report, and allows you to build computed columns for re-use.
Derived Data is very useful in determining weighted averages and other, more complex
calculations. For example, in the dataset World Life Expectancy, life
expectancy is reported at the level of each country, for each year. If you wanted to
determine the life expectancy by region or subregion, you have to calculate a weighted
average of life expectancies. You can also parametrize derived data definitions using
bracket notation.
The following steps demonstrate how to use derived data on a table visual based on the
dataset World Life Expectancy [data source
samples.world_life_expectancy].
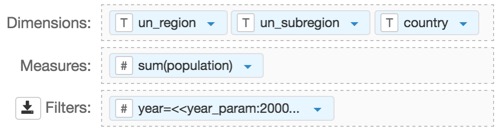
- Place the fields
un_region,un_subregionandcountryon the Dimension shelf. - Place the field
population, assum(population), on the Measures shelf. - Place the field
yearon the Filters shelf, and change the expression to[year]=<<year_param:2000>>. This enables you to dynamically change derived data calculations. You must specify a default value in the parametrized expression.