Creating annotation for dashboards
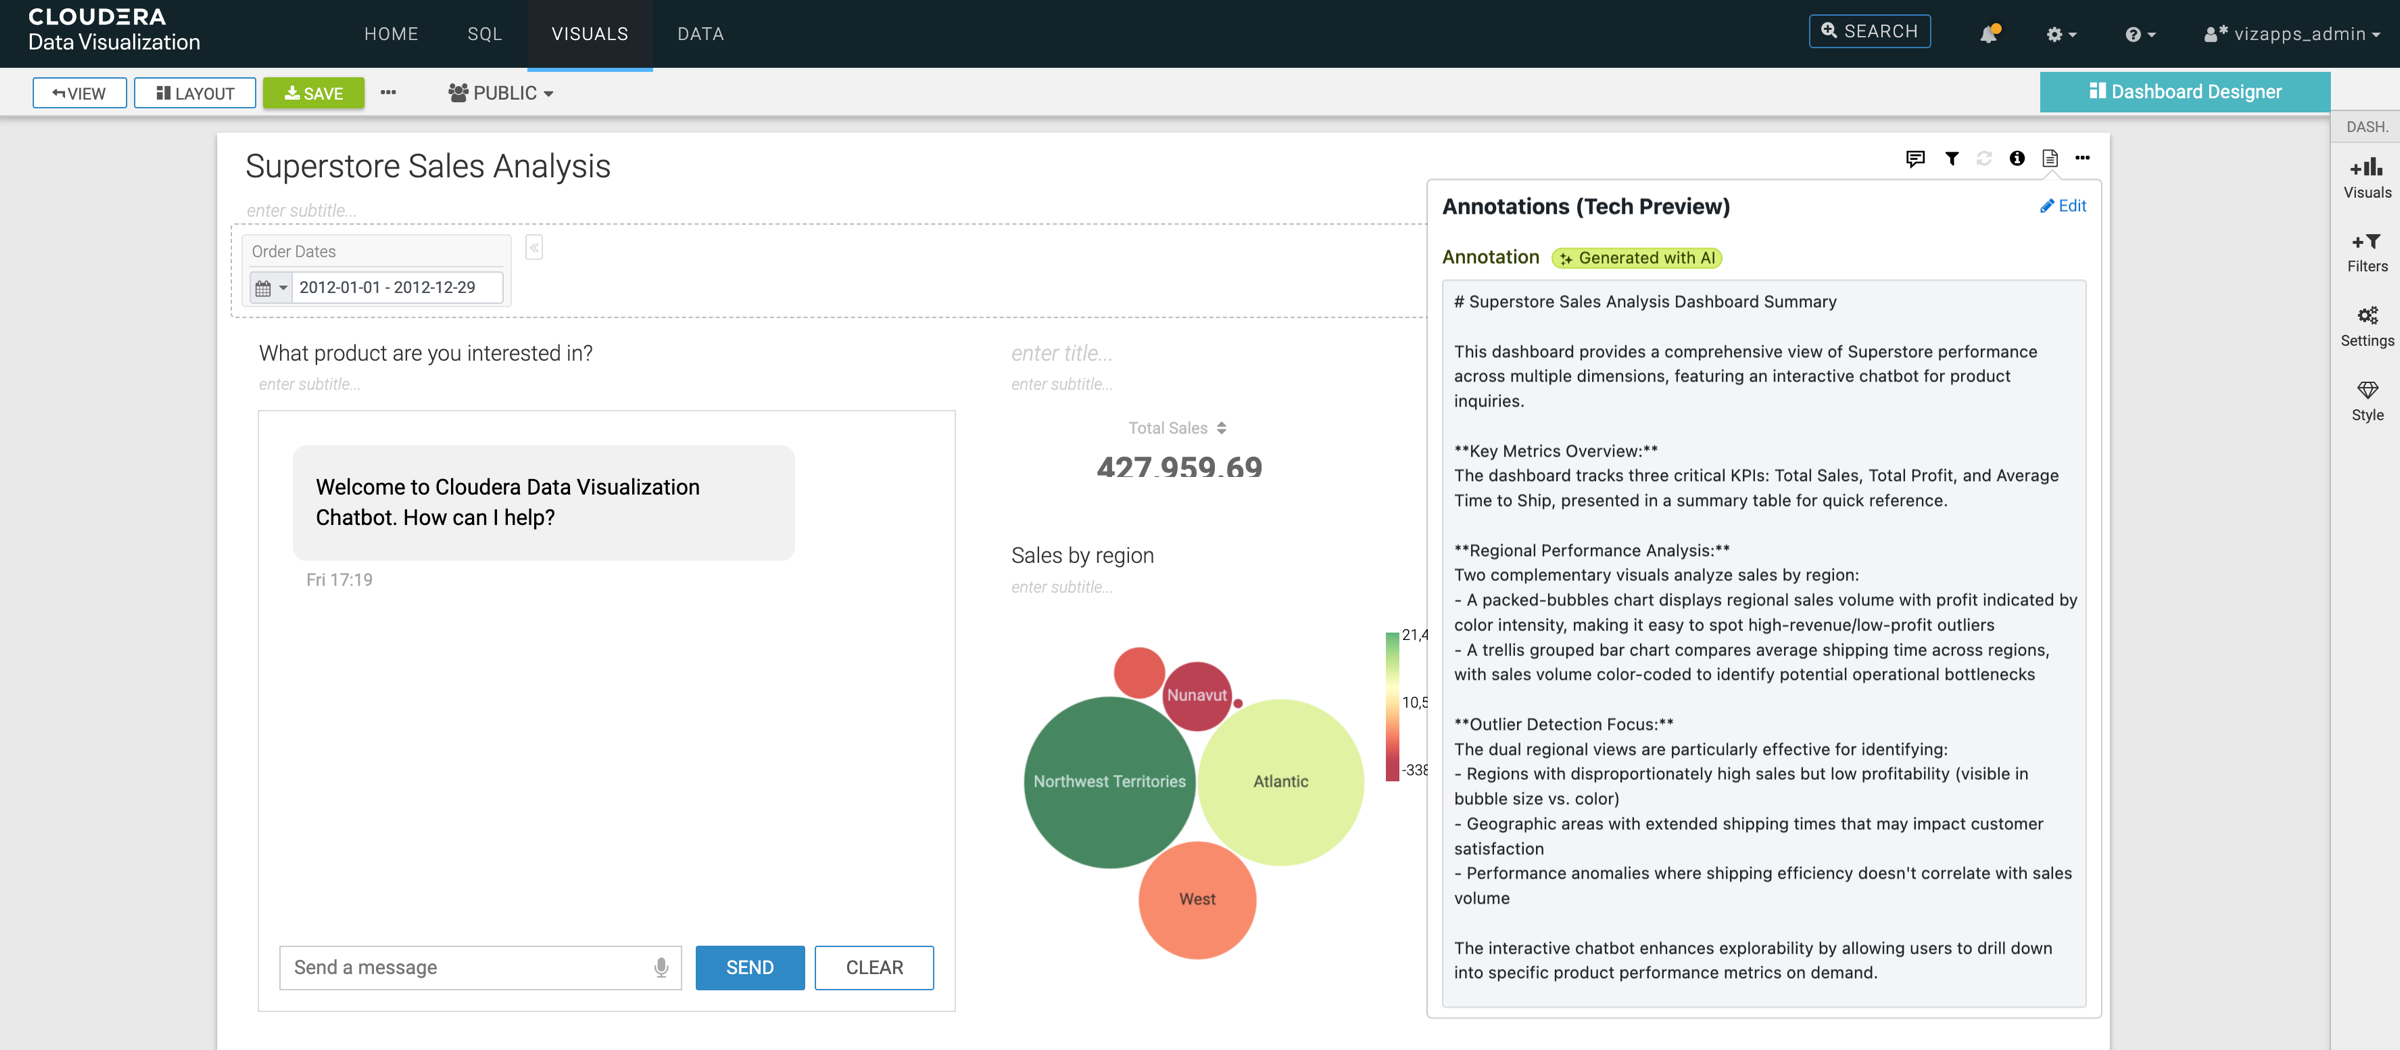
Annotations are brief summaries or description that you can associate with a visual or dashboard. You can use them to clarify data details, highlight outlier values, or provide additional context for visual consumers. The annotations feature supports both manually written descriptions and AI-generated summaries based on the data displayed in a visual.
How annotations are displayed
If a dashboard has no annotation:
- In View mode, the Annotation icon (
 )
is hidden.
)
is hidden. - In Edit mode, the Annotation icon is visible. Clicking it displays a message indicating that no annotations have been added yet, and provides the Edit option for adding an annotation.
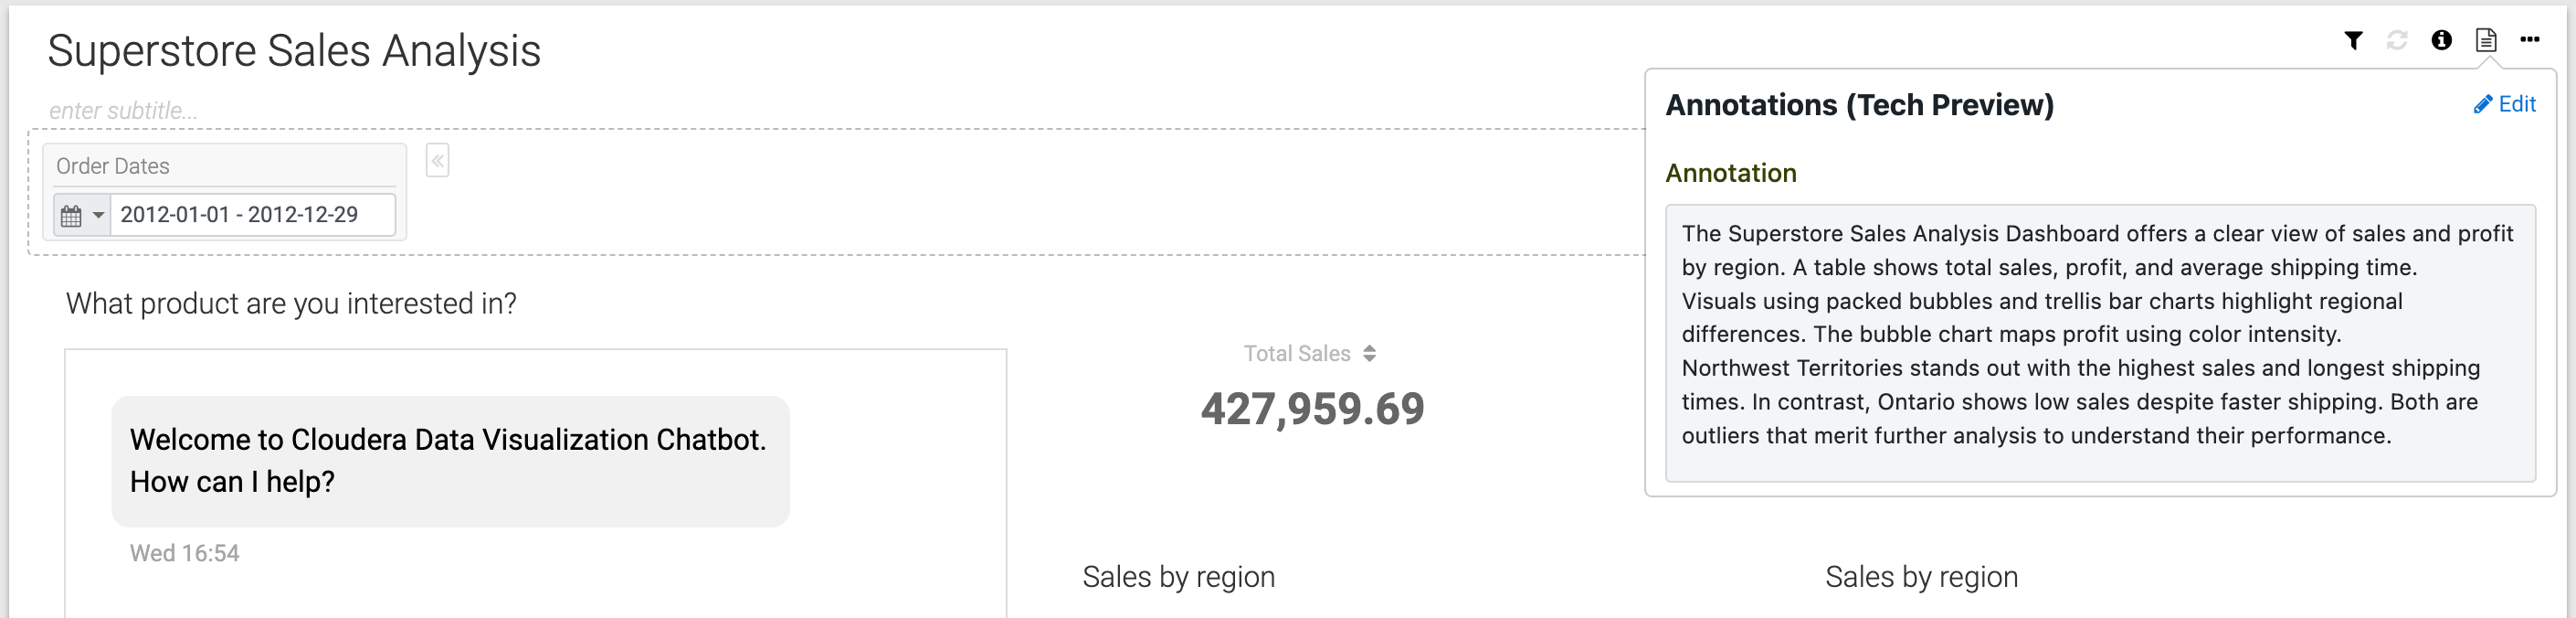
If a dashboard has an annotation:
- In View mode, the Annotation icon is visible. Clicking it or hovering over it displays the annotation.
- In Edit mode, the Annotation icon is visible. Clicking it displays the annotation, and provides the Edit option for editing the annotation.
-
You can create or edit annotations only in Edit mode.
-
To use AI-powered summarization, enable AI features and AI summary in Site Settings. If these are not enabled, only manual annotations can be created. For more information on these settings, see Managing AI settings.
Creating an AI-powered annotation
Cloudera Data Visualization allows you to generate AI-powered summaries directly from your dashboard visuals. These summaries can help you quickly identify patterns, trends, and outliers without manually analyzing each visual. Using generative AI, the system automatically analyzes the underlying data and produces concise, insightful summaries that make complex visuals easier to interpret.
-
Open a dashboard in Edit mode.
-
Click
in the top-right corner of the dashboard and click
Edit.The Annotations modal is displayed.
-
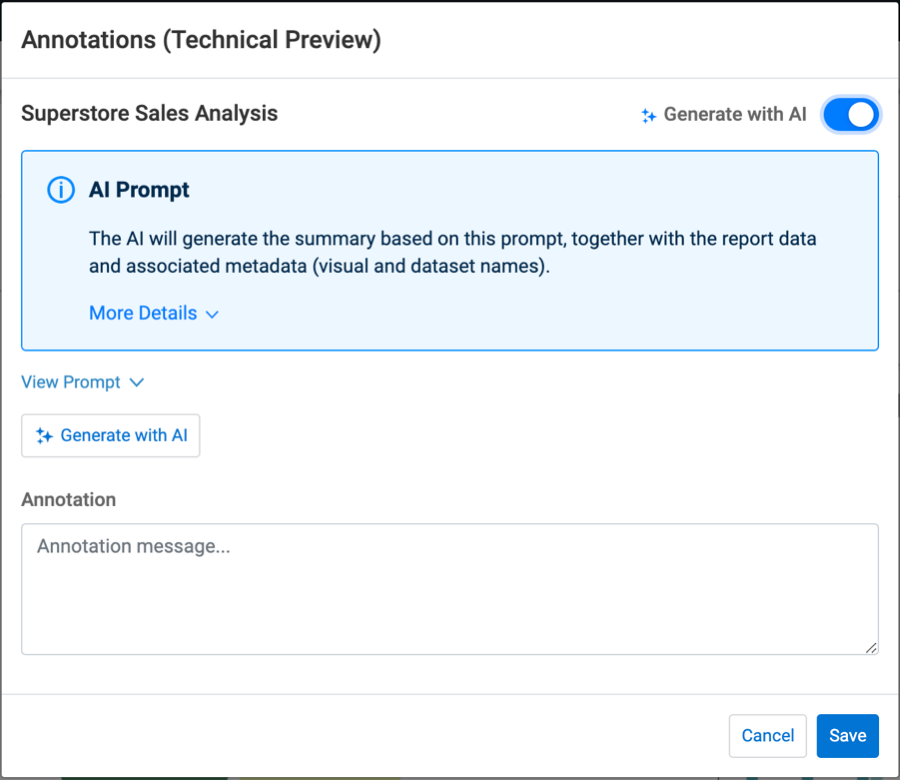
Enable the Generate with AI toggle.
Two tabs are displayed:- AI Summary – where you can configure your prompt and view your AI-generated annotation
- Advanced – where you can review metadata, dataset information, and the full AI response
-
Click View Prompt to review the default AI prompt text.
You can edit the suggested prompt or restore the default version if needed.
-
Click Generate with AI to run the prompt against the dashboard's dataset.
The AI processes the data, generates a short summary in the Annotation text field, and adds a Generated with AI label.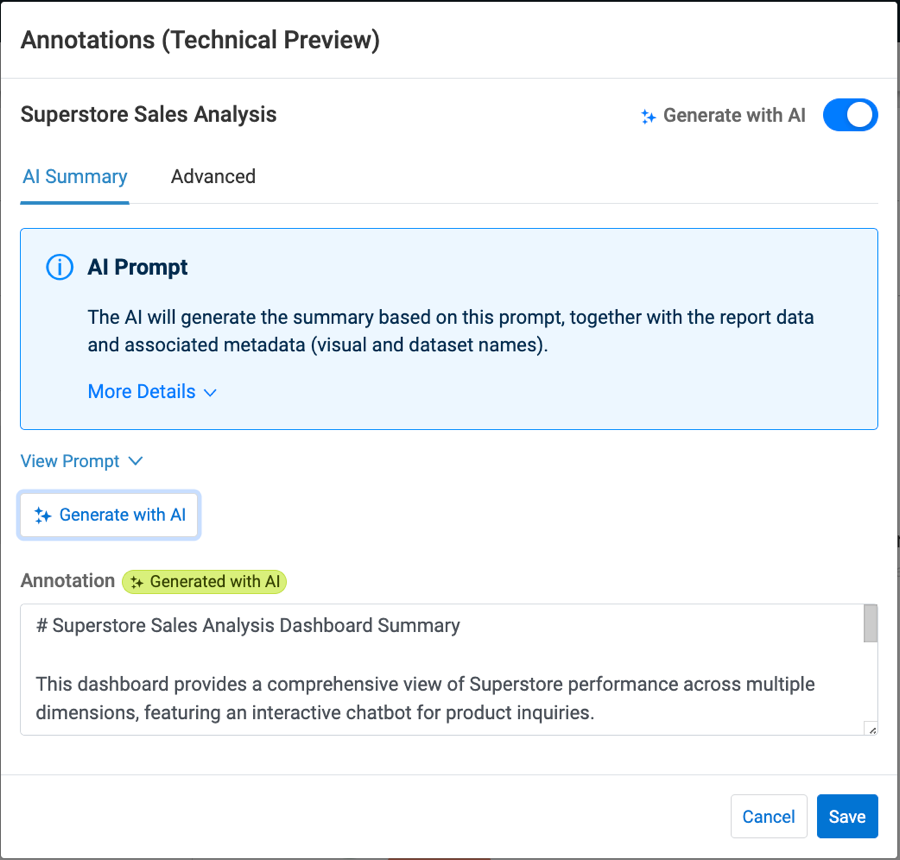
-
Review the generated annotation for accuracy.
You can edit the text before saving, ensuring that the clarity and tone of the annotation meet your needs. -
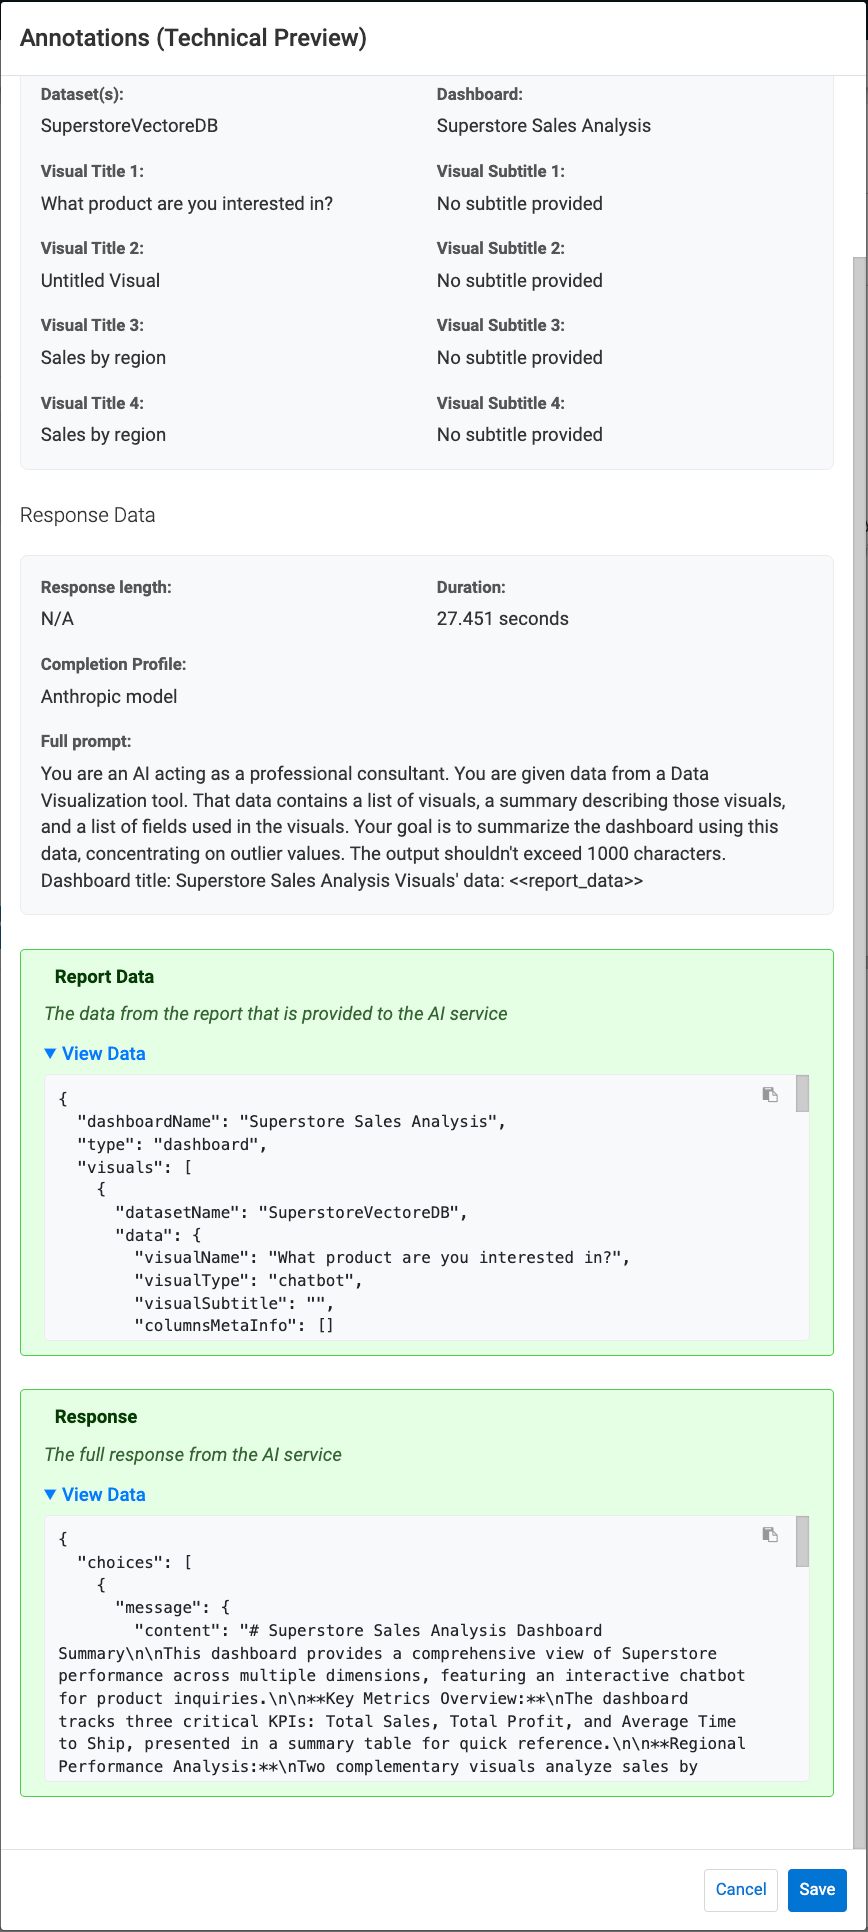
[Optional] Review technical details.
Switch to the Advanced tab to see the underlying details of the generation process, useful for validation or debugging.- Visual Data – Dataset, dashboard, and visual metadata
- Response Data – Full prompt, report data, and AI response details
-
Click Save.
Creating a manual annotation
-
Open a dashboard in Edit mode.
-
Click
in the top-right corner of the dashboard and click
Edit. The Annotations modal is
displayed.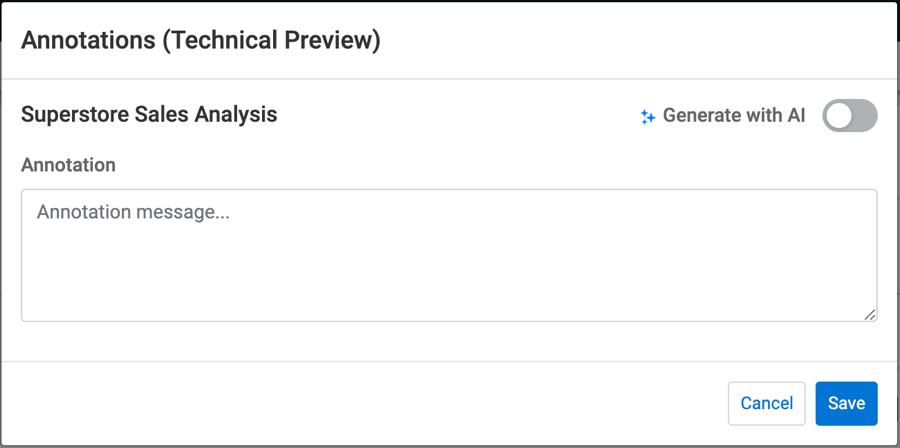
-
Enter your annotation text in the text box.
-
Click Save.