Connecting to Grafana dashboards in Cloudera Data Warehouse Private Cloud
This topic describes how to connect to Grafana dashboards to monitor your Virtual Warehouses in Cloudera Data Warehouse (CDW) Private Cloud.
To access Grafana from an environment in CDW service, the environment must be assigned to you as a resource by using Management Console. For instructions, see the links at the bottom of this page.
-
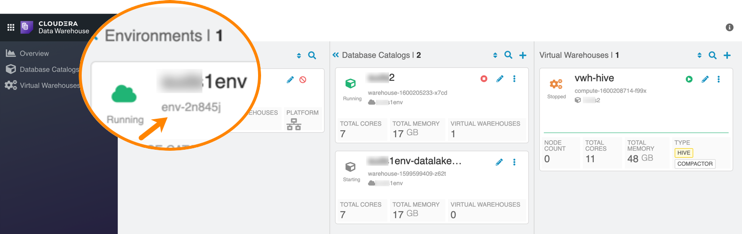
In the CDW service, select Overview in the left navigation menu, expand the Environment
column, and locate the environment that is associated with the Virtual Warehouse you want
to monitor. Make note of the environment ID, which is displayed on the environment tile in
the CDW UI:
-
Click the grid icon
 in the left navigation menu to expand the menu, and click Management Console.
-
In the Management Console UI make sure Environments is selected
in the left navigation menu, and click the CDP Control Plane Monitoring
Dashboard under Other Links in the central panel of the page:
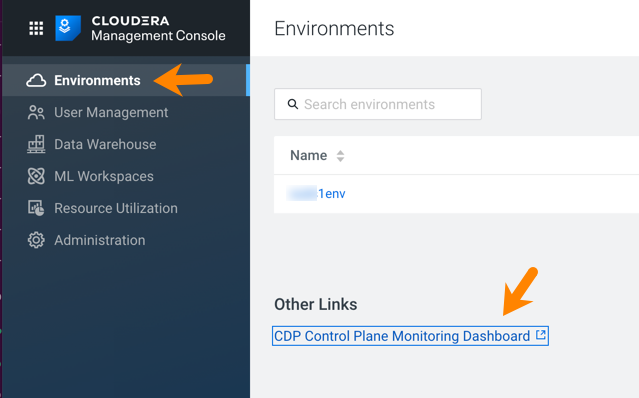
This launches the Grafana dashboard.
-
In the Grafana dashboard, click the grid icon
 in the
left navigation menu, and select Manage.
in the
left navigation menu, and select Manage.
A list of available monitoring dashboards is displayed:
CDW service area Dashboard topics CDP Control Plane alerts generated by Management Console, pod status, including count, restarts, CPU usage, memory usage, and container memory and CPU usage Data Warehouse compute auto-scaling Hive Hive metastore, HiveServer2, Hive service (Hive-Home), and several dashboards for LLAP Impala Impala components: catalog server, coordinator, executor, statestore, and the overall Impala service (Impala-Home) Hue overall Hue service (Hue-Home) Overview Kubernetes alerts, pod status, pod CPU usage, pod memory usage, app CPU usage, app memory usage, container memory usage, container CPU usage Nodes CPU, memory, network usage and disk IO metrics at the node level for a given environment