Debugging Impala Virtual Warehouses
You can use the Catalog Web UI, Coordinator Web UI, and the StateStore Web UI to debug Impala Virtual Warehouses in Cloudera Data Warehouse.
Table level events
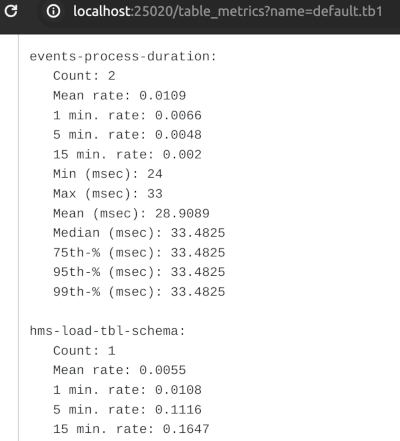
- avg-events-process-duration
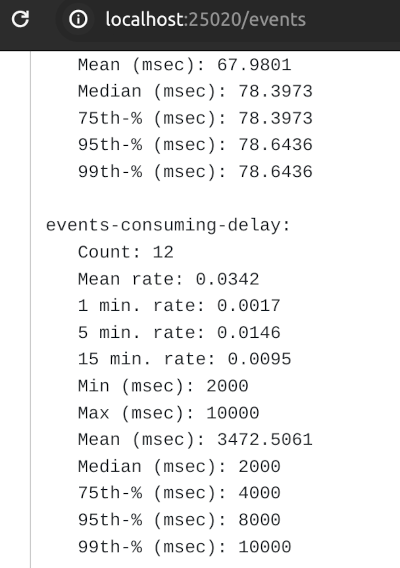
- events-consuming-delay-ms
avg-events-process-duration metric
- avg-events-process-duration-1min-rate
Exponentially weighted moving average (EWMA) of number of events processed in last 1 min
- avg-events-process-duration-5min-rate
Exponentially weighted moving average (EWMA) of number of events processed in last 5 min
- avg-events-process-duration-1min-rate
Exponentially weighted moving average (EWMA) of number of events processed in last 15 min

events-consuming-delay-ms metric
This metric represents the time difference between creating an event in the metastore and processing an event. Using this metric, you can gauge how long the event processor is lagging.

The Impala daemons (impalad,
statestored, and catalogd) debug Web UIs, which can be
used in Cloudera Runtime by using Cloudera Manager, is also available in the
Cloudera Data Warehouse service. In Cloudera Data Warehouse service, the following Web
UIs are provided:
- Impala Catalog Web UI
This UI provides the same type of information as the Catalog Server Web UI in Cloudera Manager. It includes information about the objects managed by the Impala Virtual Warehouse. For more information about this debug Web UI, see Debug Web UI for Catalog Server.
- Impala Coordinator Web UI
This UI provides the same type of information as the Impala Daemon Web UI in Cloudera Manager. It includes information about configuration settings, running and completed queries, and associated performance and resource usage for queries. For information about this debug Web UI, see Debug Web UI for Impala Daemon.
- Impala StateStore Web UI
This UI provides the same type of information as the StateStore Web UI in Cloudera Manager. It includes information about memory usage, configuration settings, and ongoing health checks that are performed by the Impala
statestoreddaemon. For information about this debug Web UI, see Debug Web UI for StateStore. - Impala Autoscaler Web UI
This UI gives you insight into autoscaler operations (regular as well as workload-aware autoscaling), accessing log messages, and resetting the log level. The autoscaler Web UI includes information about the queries queued and running, executor groups, suspended calls, scale up/down calls, the autoscaler config, and the autoscaler logs.
Required role: EnvironmentAdmin

