Viewing prebuilt dashboards
You see how to list dashboard groups, view the Hive dashboard, and see the actual metric data on a point in the X-axis. You can follow the same steps to work with other dashboards.
-
In the Welcome screen, click grid
 , and then select
Manage.
A list of dashboard groups appears:
, and then select
Manage.
A list of dashboard groups appears: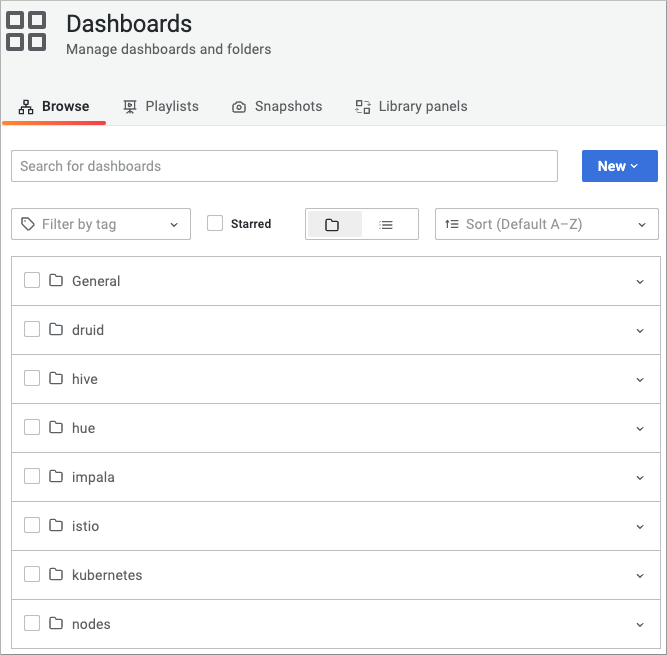
-
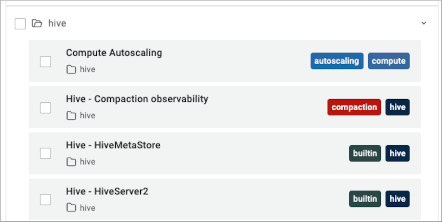
Click the name of a dashboard group.
For example, click hive.Names of the Hive dashboards in the group appear, a few of which are shown below:
-
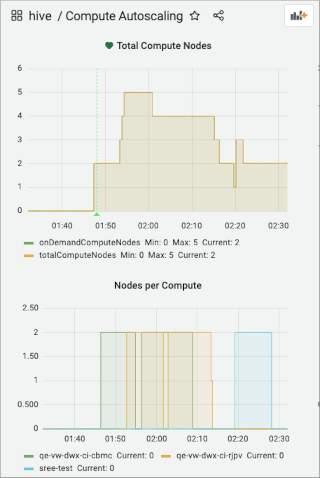
Click the name of a dashboard group.
For example, click Compute Autoscaling.A number of dashboards appear. Only two are shown below:
-
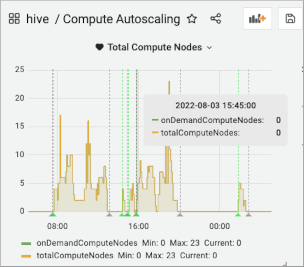
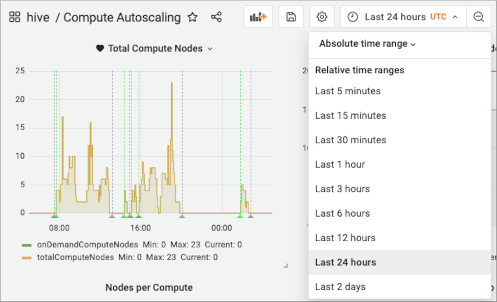
Select viewing of metrics over the last 24 hours.
-
Hover over a graphic to reveal metric data for a particular point on the X-axis.