Monitoring resources with Grafana
Grafana is visualization and analytics software for using dashboards to monitor metrics data. You learn how to access pre-built Grafana dashboards to monitor Virtual Warehouses and your compute cluster in Cloudera Data Warehouse. As a Cluster Operations professional, you visualize Kubernetes and Istio metrics from Grafana to monitor and maintain the cluster.
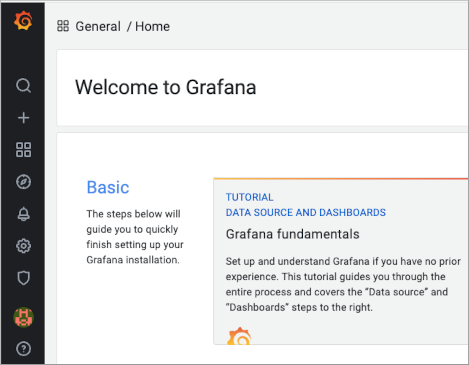
When you log into Grafana, the Welcome page contains links to documentation about Grafana basics. From the left navigation, you can get started by searching for a particular dashboard or hovering over the navigation icons to familiarize yourself with the UI functions.
As a new user, to familiarize yourself with the pre-built dashboards that chart metrics about Hive, Impala, Data Explorer, Druid, Kubernetes, and Istio in Cloudera Data Warehouse, follow steps in this documentation.