Inspecting dashboard data and queries
You can drill down into details of resource usage of Hive or Impala, get statistics about usage, and run queries on the details.
-
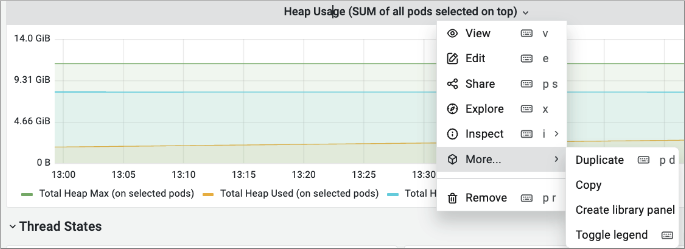
Open a dashboard, for example the HiveServer2 dashboard, and click the title in
a row, for example, the Heap usage title.
-
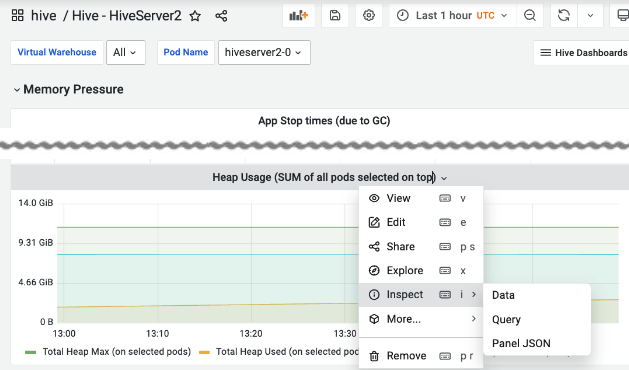
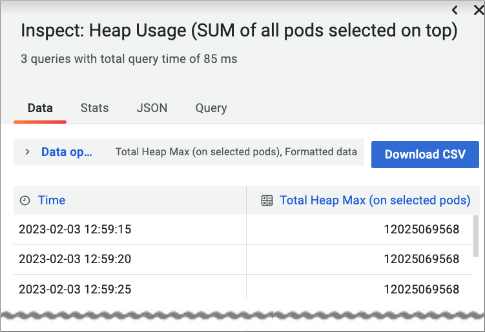
Click .
The total max heap usage over time appears.
-
In the HiveServer2 dashboard, and click the panel content.