Debugging Impala Virtual Warehouses using Web UIs
You can use the Catalog Web UI, Coordinator Web UI, and the StateStore Web UI to debug Impala Virtual Warehouses in Cloudera Data Warehouse.
The Impala daemons (impalad,
statestored, and catalogd) debug Web UIs, which can be
used in by using , is also available in the
service. In service, the following Web
UIs are provided:
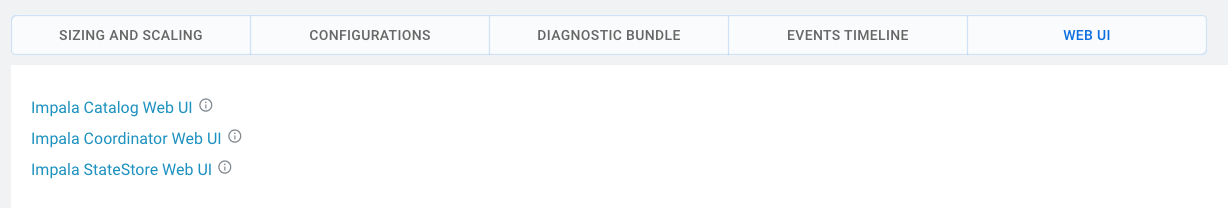
- Impala Catalog Web UI
This UI provides the same type of information as the Catalog Server Web UI in . It includes information about the objects managed by the Impala Virtual Warehouse. For more information about this debug Web UI, see Debug Web UI for Catalog Server.
- Impala Coordinator Web UI
This UI provides the same type of information as the Impala Daemon Web UI in . It includes information about configuration settings, running and completed queries, and associated performance and resource usage for queries. For information about this debug Web UI, see Debug Web UI for Impala Daemon.
- Impala StateStore Web UI
This UI provides the same type of information as the StateStore Web UI in . It includes information about memory usage, configuration settings, and ongoing health checks that are performed by the Impala
statestoreddaemon. For information about this debug Web UI, see Debug Web UI for StateStore. - Impala Autoscaler Web UI
This UI gives you insight into autoscaler operations (regular as well as workload-aware autoscaling), accessing log messages, and resetting the log level. The autoscaler Web UI includes information about the queries queued and running, executor groups, suspended calls, scale up/down calls, the autoscaler config, and the autoscaler logs.
Required role: EnvironmentAdmin
Make sure that you note your workload user name and have set a password for it in the User Management module of . You need to use your workload user name and its associated password to log into the debug Web UIs. For more information, see Setting the workload password in the documentation set.
-
In the UI on the
Overview page, locate the Impala Virtual Warehouse for which you
want to view the debug UIs, and select
 > Details.
The Virtual Warehouse Details page is displayed.
> Details.
The Virtual Warehouse Details page is displayed. -
In the Virtual Warehouse Details page, select the Web
UI tab. The list of debug Web UI links are displayed as shown in the
following image: