Meeting prerequisites to set up alerts
Before you can set up an alert triggered by a dashboard event, you must configure an SMTP (Simple Mail Transfer Protocol) server, an alert recipient, and a notification policy.
-
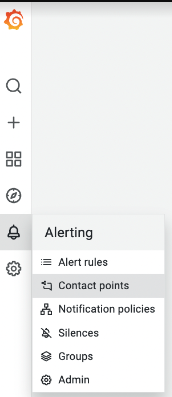
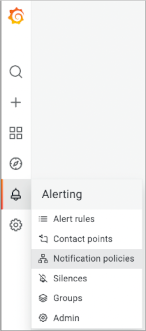
Log into Grafana, and click .
-
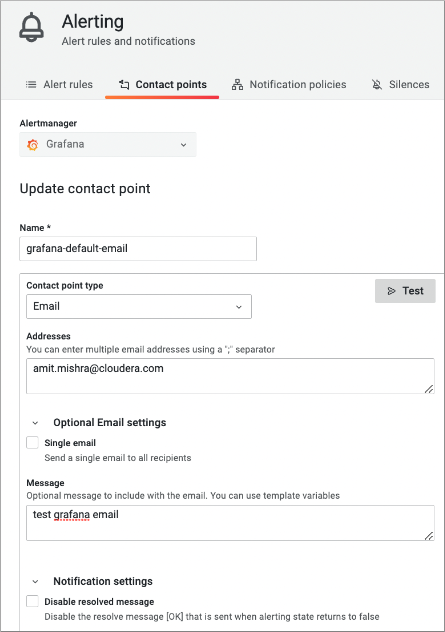
In Addresses, enter an email address, and then in
Message, compose an email message body.
For example, enter an email message body test grafana email.
-
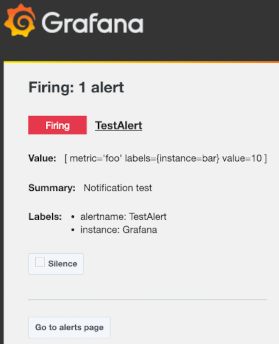
Click Test to verify that a test alert arrives in your
inbox.
-
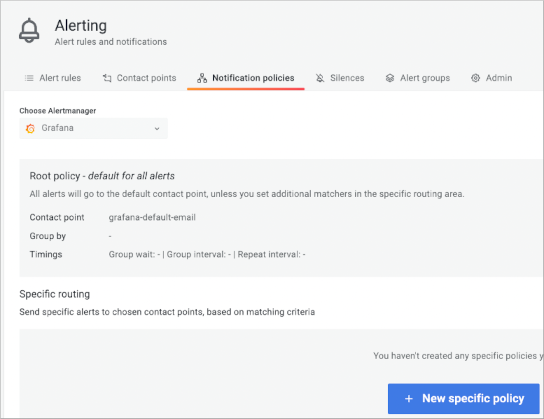
Log into Grafana, and click .
-
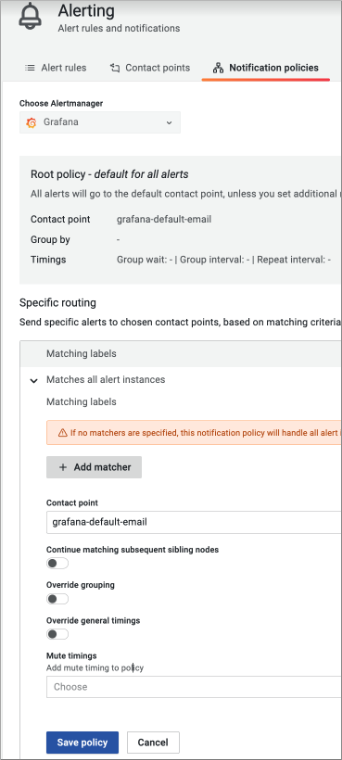
Click New specific policy.
-
In Contact Point, select the contact point to receive notification, and save
the policy.