Monitoring key Hive metrics
You can get metrics about the status of HiveServer.
-
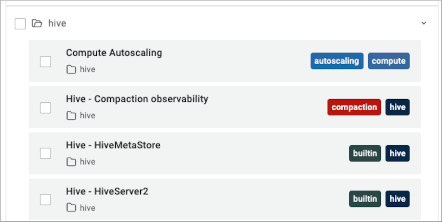
Go back to the list of Hive dashboards, and select Hive - HiveServer2.
-
In Virtual Warehouse, and then in Pod Name, accept the default All, or select a
particular Virtual Warehouse and pod.
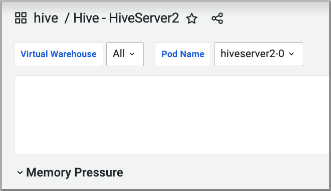 In Memory Pressure, metrics about the overall status of HiveServer memory usage appear.
 -
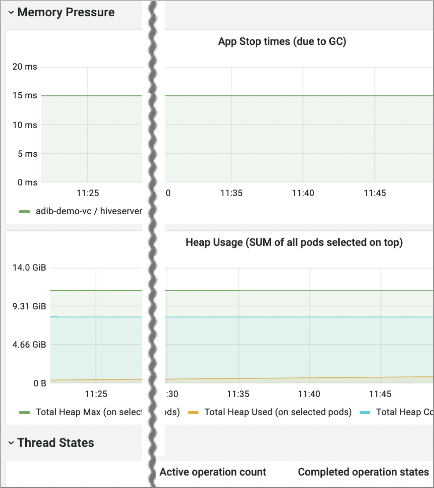
Click each row title to expand and look at various metrics: App stop times due
to garbage collection, heap usage, active thread operation count, and completed
thread operation states.
-
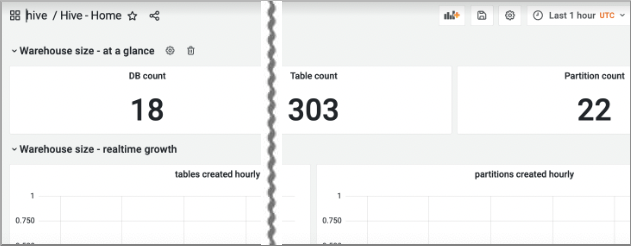
In hive / Hive - Home, you can monitor warehouse growth from metics on the
tables and partitions created hourly.