Viewing a compaction alert using Grafana

Learn how you can use Grafana dashboards to view compaction alerts and take necessary actions to keep your cluster healthy.

You must be able to log into Grafana from Cloudera Data Warehouse (CDW) as described in the 'Getting started in Grafana' topic.
  1. In the Data Warehouse service, click Overview and expand the Environments column.
  2. Click and locate an environment that you activated for Cloudera Data Warehouse (CDW), which has the default Database Catalog.
  3. Click the environment options and select Open Grafana.

    Option to launch Grafana from CDW
  4. In the Grafana web interface, click and then select Dashboards.
    A list of dashboard groups is displayed.
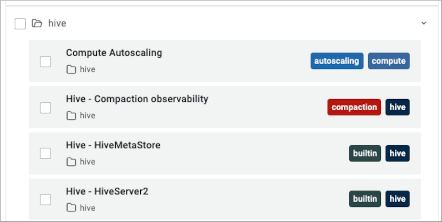
  5. Locate and click the Hive - Compaction observability dashboard group to view all the dashboards related to Hive compactions.

    Grafana Hive prebuilt dashboards