Monitoring Impala admission control
You can monitor Impala admission control from Grafana.
-
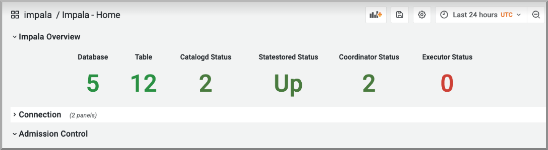
In the list of Impala dashboards, and select Impala - Home.
In Impala Overview, the number of of Impala databases, tables, the catalogd status, and other metrics appear.
-
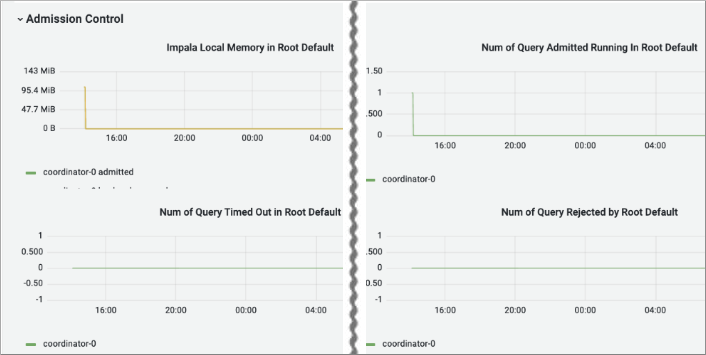
In Admission Control, view the Impala local memory in root default, the number
of queries admitted that are running in root default, and the queries in root
default (not shown).
-
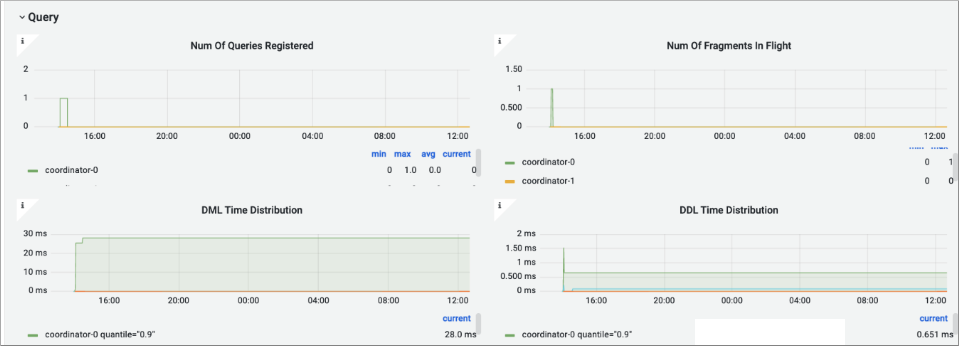
Scroll down and in Query view the number of registered queries, fragments in
flight, number of open files (not shown), data manipulation language (DML) time
distribution, and data definition language (DDL) time distribution.