Monitoring Impala coordinators
You can monitor Impala coordinators caching, resource use, such as files handles hit, memory consumption, and more.
-
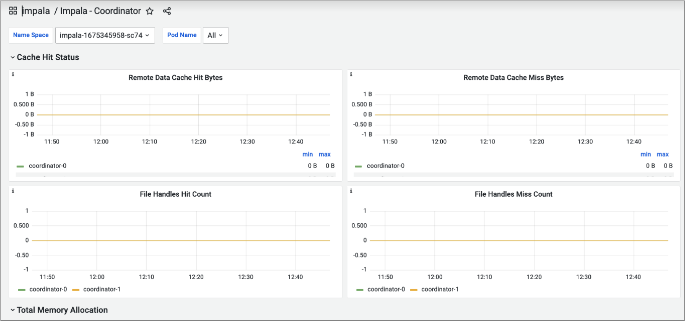
Select a name space and pods, and view cache hit status, remote data cache miss bytes, catalog cache hit rate (not shown), file handles hit count, and file handles miss count.
-
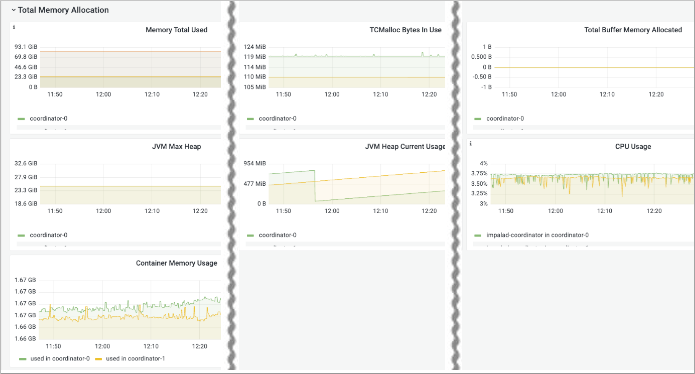
Scroll down to Total Memory Allocation and view memory used, TCMalloc bytes in
use, total buffer memory allocated, JVM max heap, JVM heap current usage, and
CPU usage.