Grafana in Cloudera Data Warehouse overview
You connect to prebuilt dashboards to view metrics of Cloudera Data Warehouse operations. Cloudera provides prebuilt Grafana dashboards for Hive, Impala, Data Explorer, Druid, Kubernetes, and Istio dashboards of metrics data, charts, and other visuals.

You can also create your own dashboards. "Get started with Grafana and Prometheus" describes how to create dashboards of Cloudera metrics. Describing all the details of how to use Grafana is beyond the scope of this documentation. Grafana described in this documentation is not the enterprise version.
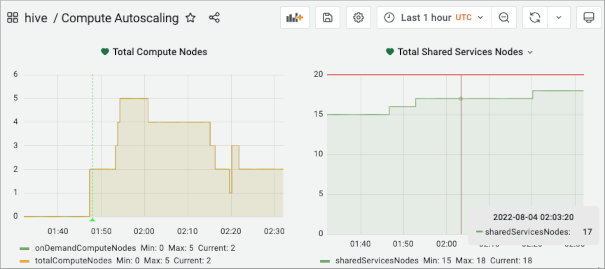
Hive dashboards
- Auto-scaling
- Hive metastore
- HiveServer
- The Hive service itself (Hive-Home)
- LLAP
Impala dashboards
- Catalog server
- Coordinator
- Executor
- Statestore
- The Impala service itself
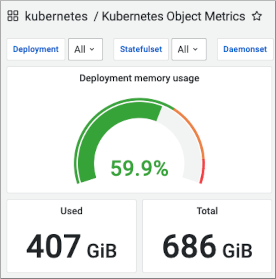
Kubernetes dashboards
- CoreDNS: requests and duration of responses
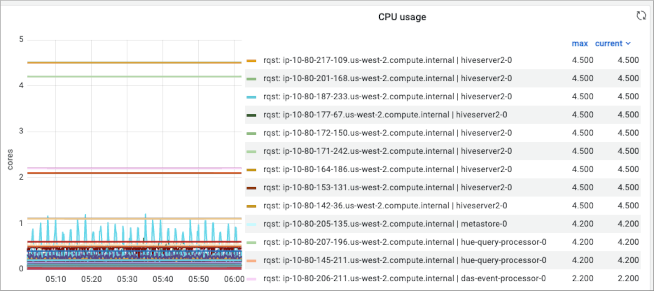
- App Metrics: number of Kubernetes pods, CPU usage relative to request or to limit, memory usage sliced and diced a number of ways
- Object Metrics: Deployment memory and CPU usage, in total, and by node.
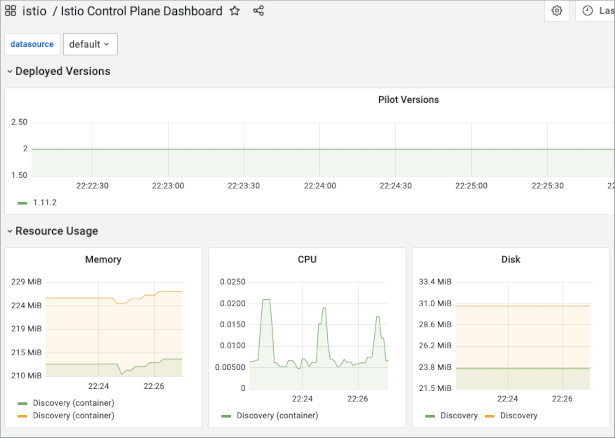
Istio dashboards
- Istio Mesh summary: describes the network of microservices by HTTP/gRPC and TCP workloads in the Mesh.
- Individual Cloudera services, such as HiveServer and Impala coordinator: Request and response metrics, such as latency, for each mesh service (HTTP/gRPC and TCP) and client and service workloads metrics.
- Individual workloads using the services: Request and response metrics for each workload in the Mesh (HTTP/gRPC and TCP) and inbound/outbound workload services.
- Cloudera Usage
- Memory Usage
- Data Rates
- Bytes transferred per second
The Istio control plane dashboard includes memory, CPU, and disk resource usage.
The sidecar proxy metrics in Istio dashboards reveals the interceptions of network communication between microservices.
The Istio Wasm Plugin extends the Istio proxy capabilities.
Nodes dashboards
The Prometheus Node Exporter is used to gather
detailed metrics for the AWS and Azure Virtual Machines that host an environment's
Kubernetes cluster. These metrics cover both machine and OS level metrics such as
CPU, memory, network, processes, time synchronization, disk, and file system. All
metric names start with node_.
- Cluster Totals
Shows CPU/Memory utilization and node counts (shared services/compute for the entire cluster.
- Node Details
Shows very detailed metrics for a single node at a time.
- Node Trends
Combines CPU, Memory, Disk, and Network metrics for all nodes for node-to-node comparisons.