Monitoring HMS
You can monitor Hive Metastore (HMS), heap usage, and key Hive metrics.
-
In the Welcome screen, click grid
 , and then select
Manage.
A list of dashboard groups appears:
, and then select
Manage.
A list of dashboard groups appears: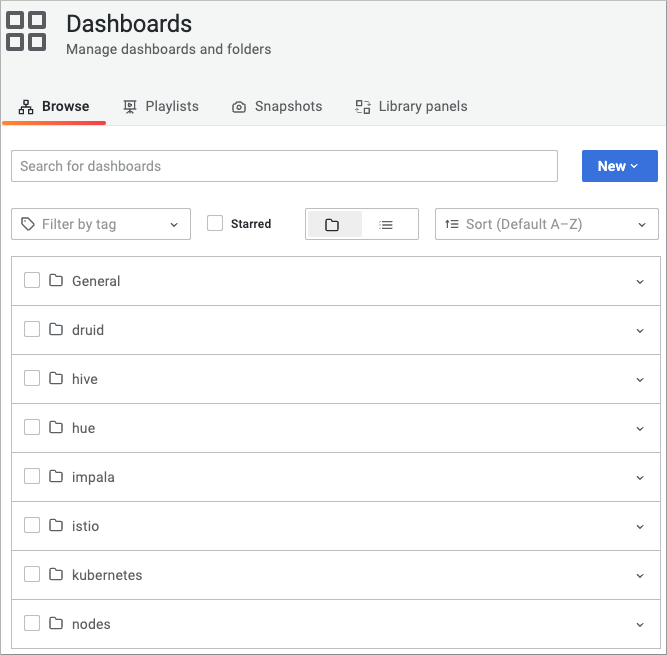
-
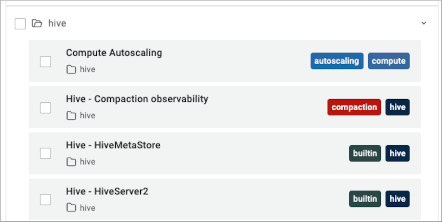
Select the hive dashboard.
Names of the Hive dashboards in the group appears, a few of which are shown below:
-
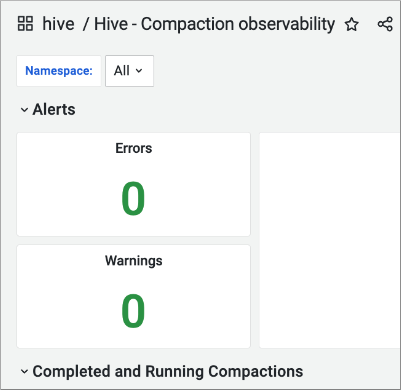
Select Hive - Compaction observability, and in Namesparce, select a
namespace.
In Alerts, the error indicator shows the number of errors and warnings.
-
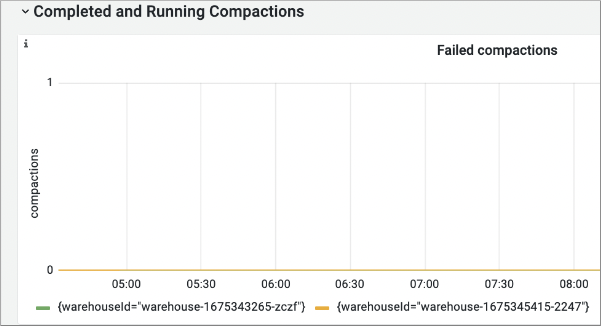
Expand Completed and Running Compactions.
Graphs showing the status of compactions appears.
-
Go back to the list of Hive dashboards, and select Hive - HiveMetaStore.
-
In Database Catalog, and then in Pod Name, accept the default All, or select a particular Database Catalog and pod.
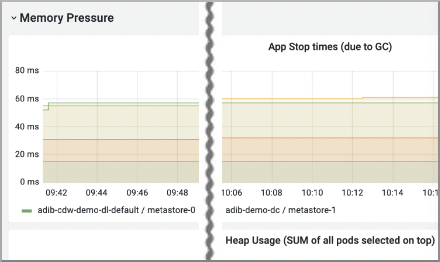
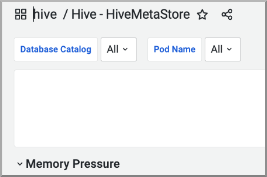 In Memory Pressure, metrics about the overall status of HMS appear.
 -
Click each row title to expand and look at various metrics: app stop times due
to garbage collection and heap usage.