Monitoring Impala catalog
You can monitor Impala catalogd from Grafana.
-
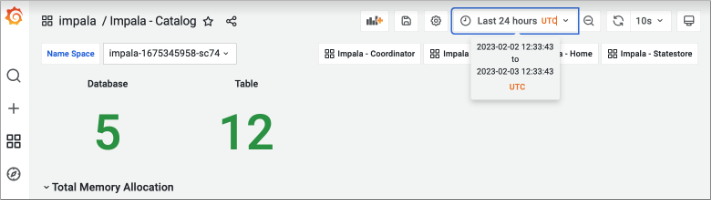
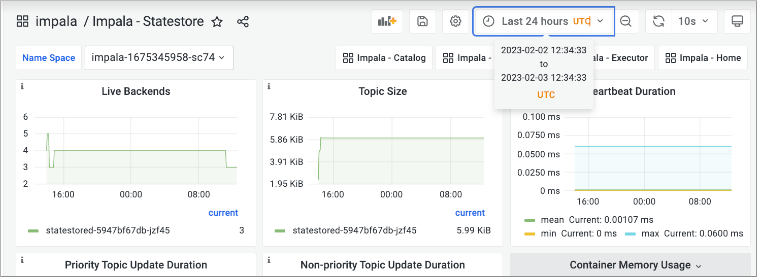
Select a Name Space, and from the Last 24 hours dropdown, select an time
interval to monitor.
-
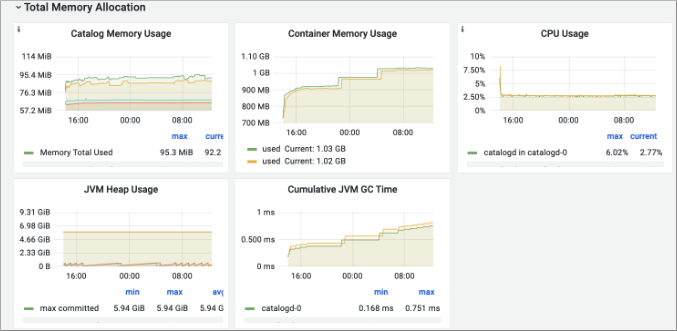
View catalog memory usage, container memory usage, cpu usage, JVM heap usage,
and cumulative JVM garbage collection time.
-
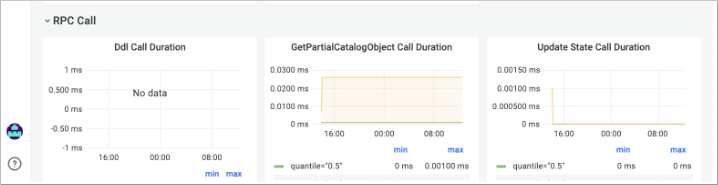
Scroll down, and view remote procedure call metrics.
-
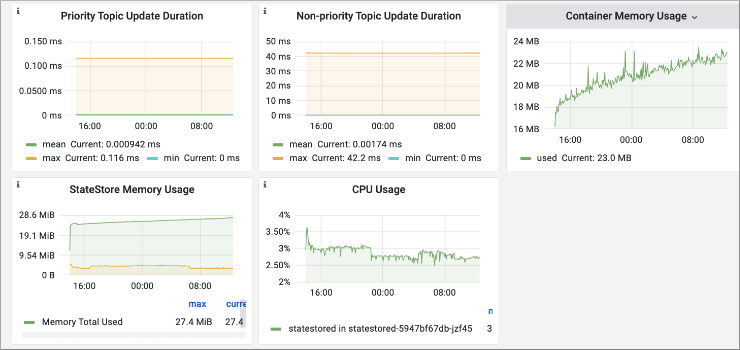
Scroll down, and view Impala statestore metrics.
-
Scroll down, and view update, memory, and CPU metrics.