Monitoring Kubernetes Services from Grafana
You can monitor the Amazon Elastic Kubernetes Service (EKS) or the Azure Kubernetes Service (AKS) used by your Cloudera Data Warehouse cluster from Grafana.
-
In the Welcome screen, click grid
 , and
then select Manage.
A list of dashboard groups appears:
, and
then select Manage.
A list of dashboard groups appears: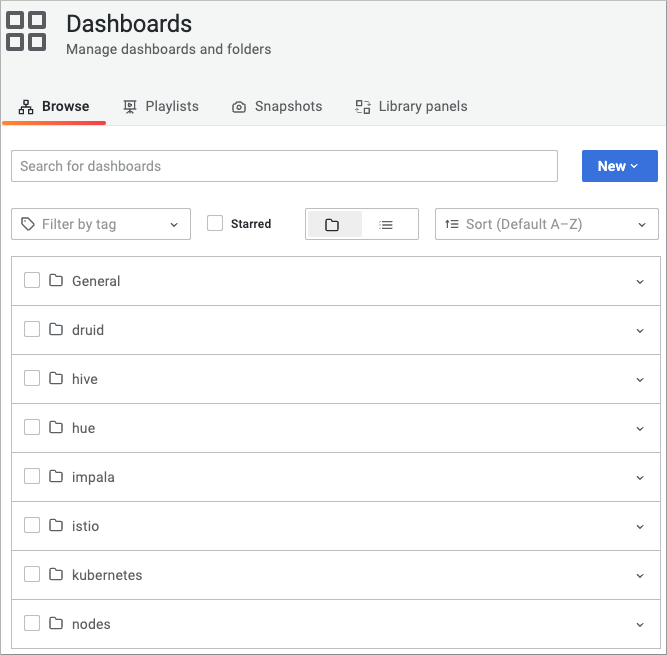
-
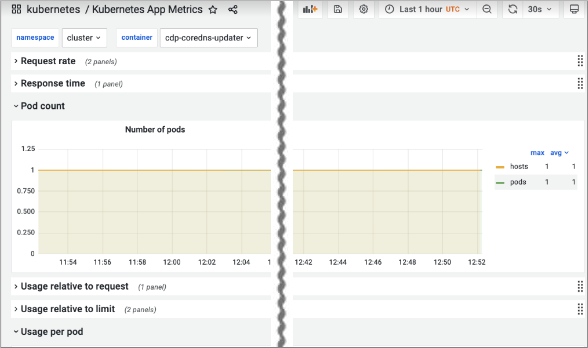
Click the Kubernetes App Metrics, and then select a namespace, for example
cluster, and container, for example a container named cdp-coredns-updater.
View a graph and metrics of the number of pods.
-
View the CPU usage per pod.
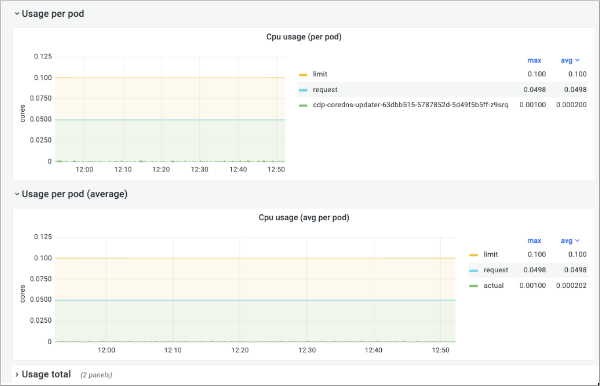
-
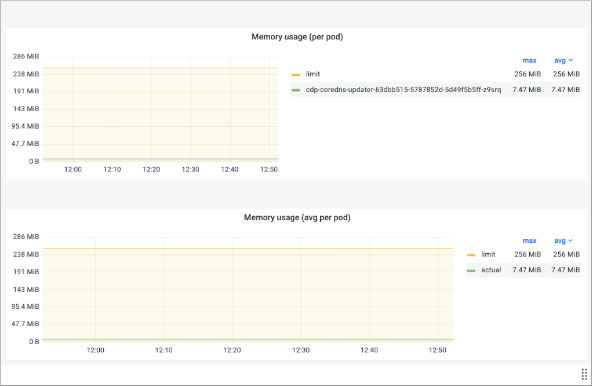
On the right, view the memory usage per pod.
-
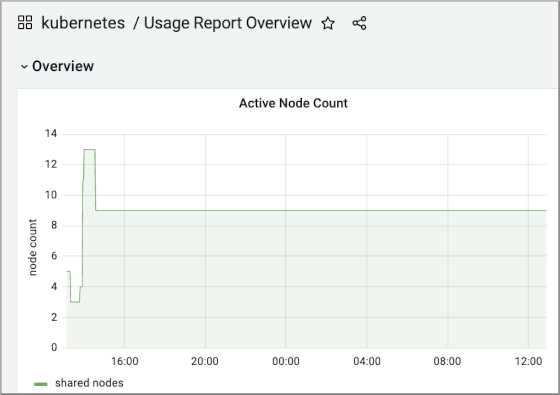
From the kubernetes dashboard group, click Usage Report Overview, and see the
active nodes on the X axis of the Active Node Count graph.