Using the K8S dashboard
You see how to view the dashboard and get ideas about the types of K8S metrics, charts, and other visualizations that appear on the dashboard. You might use the dashboard to keep your cluster running efficiently and troubleshoot problems.
- You have met the prerequisites listed in Monitoring Kubernetes resources.
- You have activated the K8S dashboard.
-
In Environment Details, click Open
 .
.
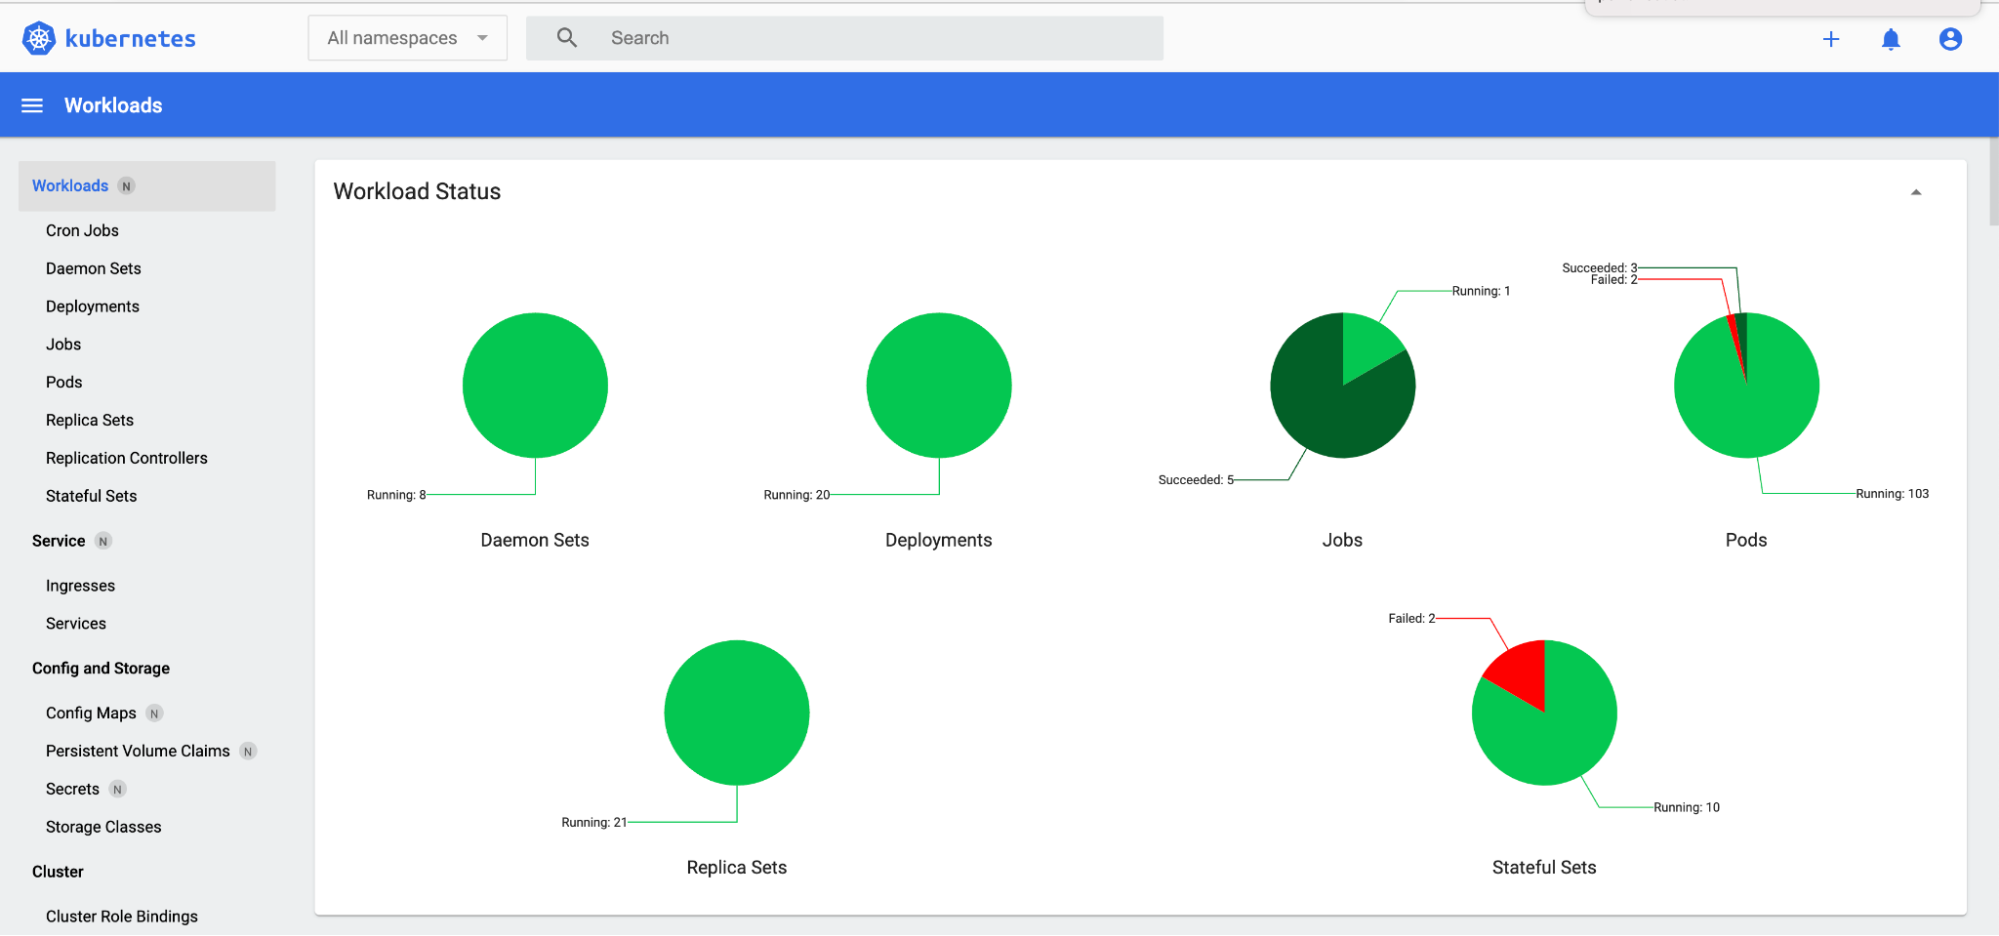
 The K8S dashboard appears.
 -
View the status of your containerized applications.
For example:
-
Click All Namespaces and select a specific Namespace.
 The workload status of the namespace, impala-167998, in this example appears.
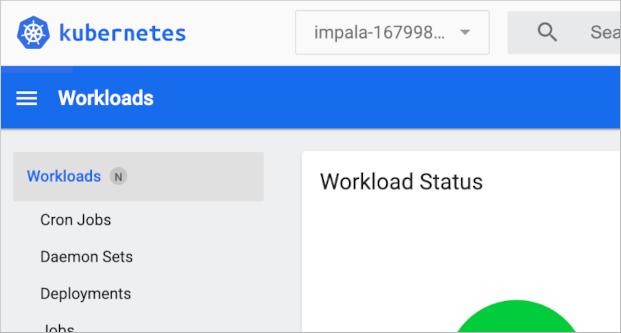
-
To download logs, click Pods.
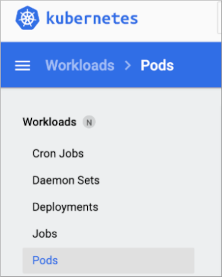 The dashboard of pods appears.
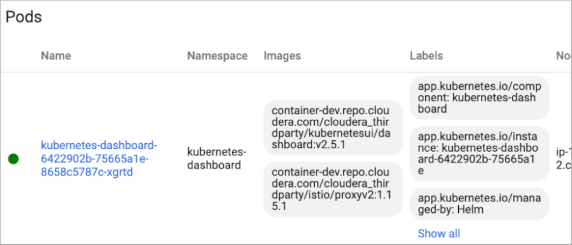
-
Click
 , and select
Logs.
For example:
, and select
Logs.
For example: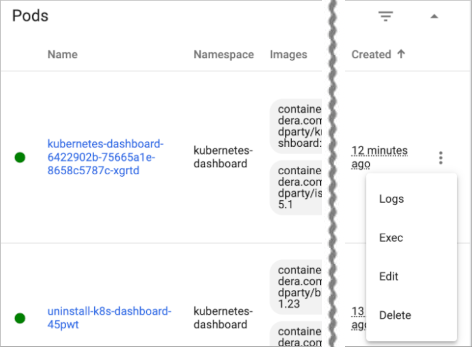 Logs appear.
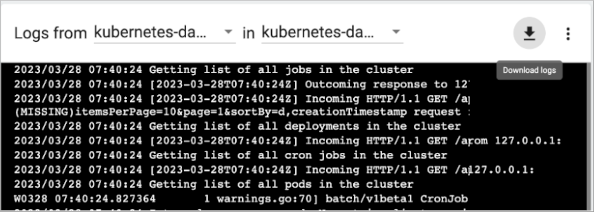
-
Click Download logs
 .
.