Monitoring nodes
You can get Kubernetes, cluster health, and node health information by monitoring Cloudera Data Warehouse nodes.
-
In the Welcome screen, click grid
 , and then select
Manage.
A list of dashboard groups appears:
, and then select
Manage.
A list of dashboard groups appears: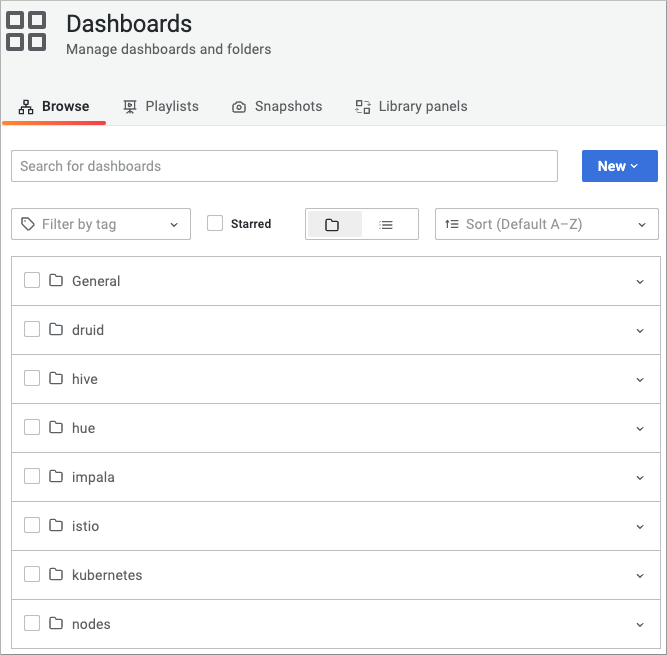
-
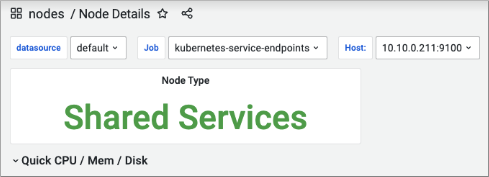
In the list of nodes dashboards, click Node Details, and
then set the node of interest: In datasource, set default
for example; in Job, set kubernetes-service-endpoints for
example; in Host, set the IP address of a host in the Cloudera Data Warehouse cluster.
-
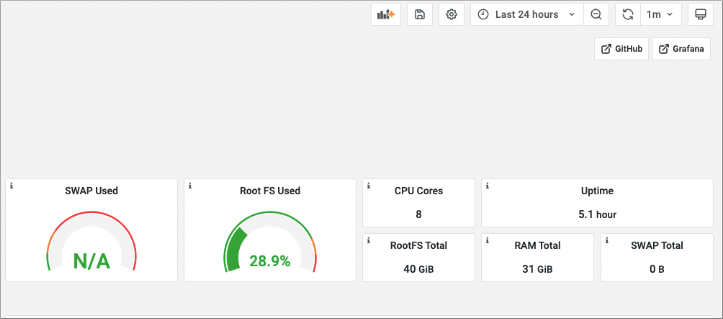
On the right side of the dashboard, with Last 24 hours
selected, for example, view the SWAP space used, root file
system used, CPU cores used, and uptime of the node.
-
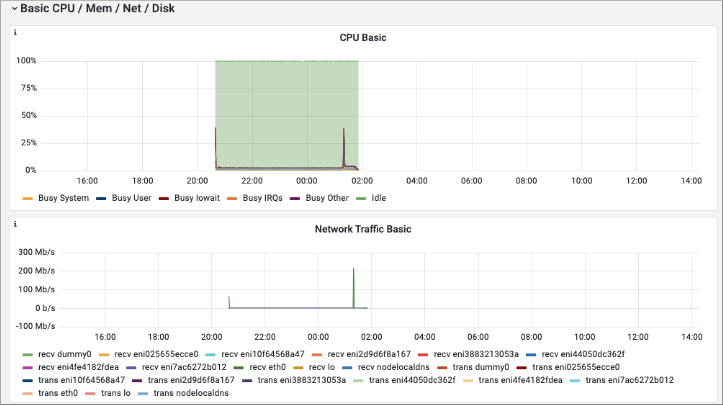
Scroll down, expand Basic CPU/Mem/Net/Disk, and see
graphs on the left showing metrics about high activity from various souces, such
as a busy user or busy interrupt requests (IRQ), and a graph of packets received
and transmitted by network traffic.
-
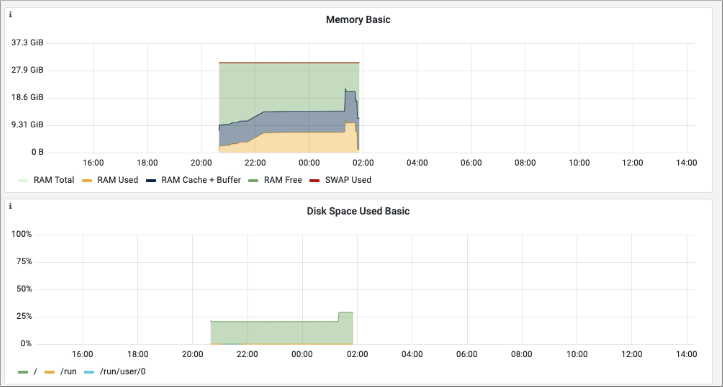
On, the right, see graphs of basic memory and disk space use.
-
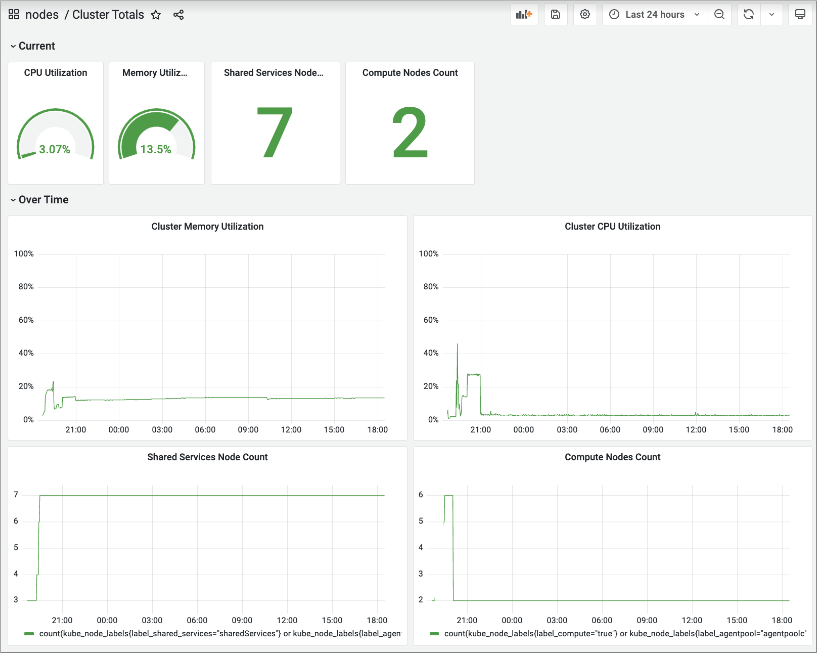
In the list of nodes dashboards, click Cluster Totals to
view cluster health in graphs and metrics over the past 24 hours, as indicated
by Cluster Memory Utilization, Cluster CPU Utilization, Shared Services Node
Count, and Compute Nodes Count.
-
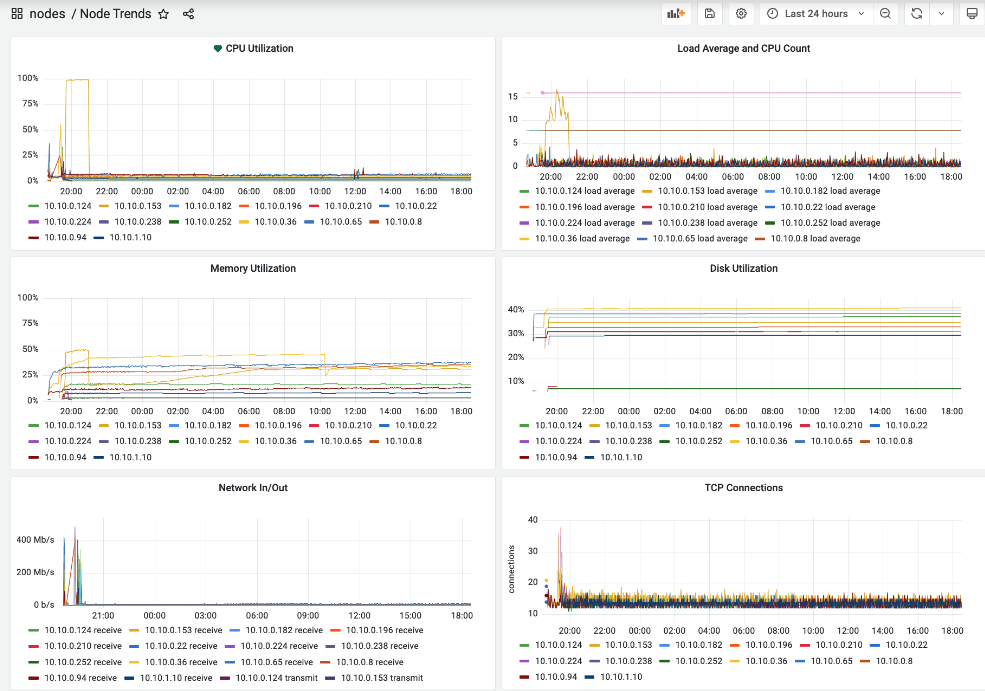
In the list of nodes dashboards, click Node Trends to
view node health over the past 24 hours, as indicated by CPU Utilization, Load
Average and CPU Count, Memory Utilization, and Disk Utilization.