Updating a dashboard graph
You can view, edit, share, explore, or remove a dashboard graph, and more.
-
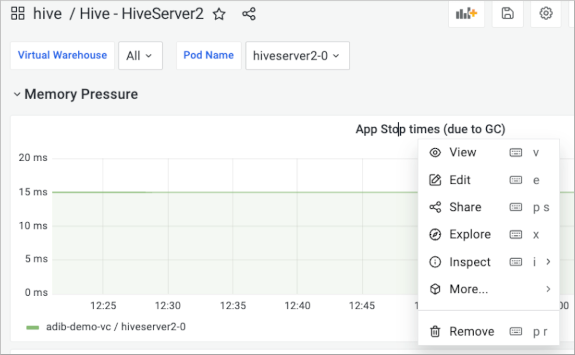
Open a dashboard, for example the HiveServer2 dashboard, and click the title in
a row, for example, the App Stop times title.
-
Click Edit.
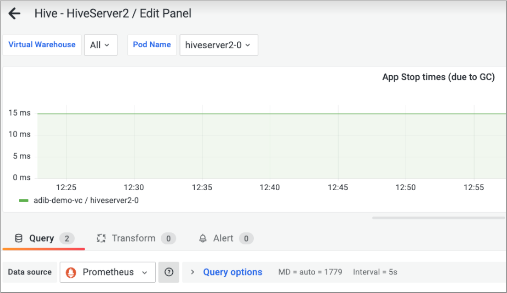
The edit panel appears.
-
At the top right side of the edit panel, click
 to add variables
and permissions to the panel.
to add variables
and permissions to the panel.
-
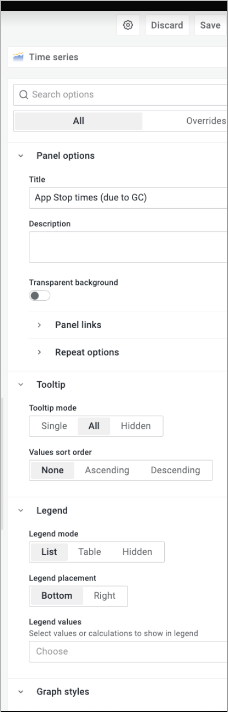
On the right side of the edit panel, select a graph type, such as Time Series,
and specify panel options, such as the title of the graph, tooltip mode, legend,
graph styles, and more.
-
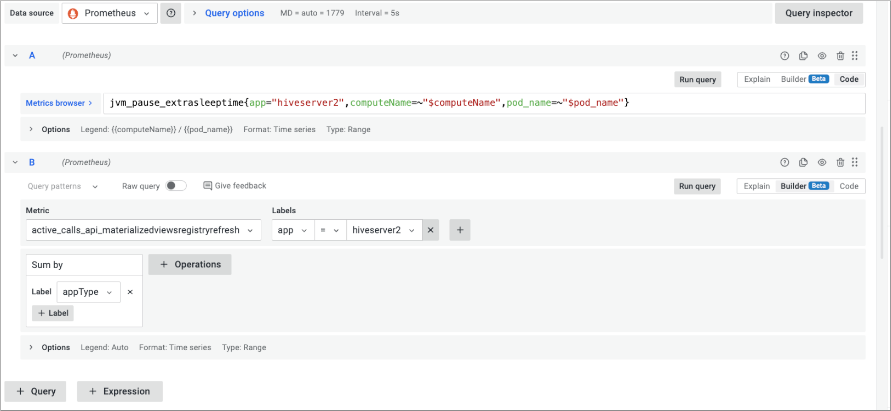
Scroll down the edit panel, and change query options.
For example, in Metrics browser, change the metrics to be graphed from jvm_pause_extrasleeptime.
-
On the right side of the edit panel, use the Builder code option
 to
frame the query and Explain to understand the query.
to
frame the query and Explain to understand the query.