Cloudera Manager Primer
Cloudera Manager is an end-to-end application for managing CDH clusters. Cloudera Manager sets the standard for enterprise deployment by delivering granular visibility into and control over every part of the CDH cluster—empowering operators to improve performance, enhance quality of service, increase compliance and reduce administrative costs. With Cloudera Manager, you can easily deploy and centrally operate the complete CDH stack and other managed services. The application automates the installation process, reducing deployment time from weeks to minutes; gives you a cluster-wide, real-time view of hosts and services running; provides a single, central console to enact configuration changes across your cluster; and incorporates a full range of reporting and diagnostic tools to help you optimize performance and utilization. This primer introduces the basic concepts, structure, and functions of Cloudera Manager.
Terminology
To effectively use Cloudera Manager, you should first understand its terminology. The relationship between the terms is illustrated below and their definitions follow:
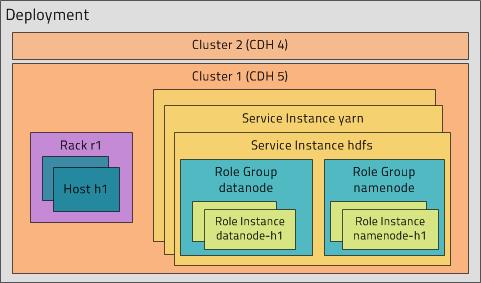
- deployment - A configuration of Cloudera Manager and all the clusters it manages.
- cluster - A logical entity that contains a set of hosts, a single version of CDH installed on the hosts, and the service and role instances running on the hosts. A host can belong to only one cluster.
- host - A physical or virtual machine that runs role instances.
- rack - A physical entity that contains a set of physical hosts typically served by the same switch.
- service - A category of functionality within CDH. Sometimes referred to as a service type. For example: MapReduce, HDFS, YARN. It's also helpful to always remember this basic principle: Whereas in traditional environments multiple services run on one host, in CDH—and other distributed systems—a service runs on many hosts.
- service instance - An instance of a service running on a cluster. A service instance spans many role instances. For example: "hdfs" and "yarn".
- role - A category of functionality within a service. For example, the HDFS service has the following roles: NameNode, SecondaryNameNode, DataNode, and Balancer. Sometimes referred to as a role type.
- role instance - An instance of a role running on a host. It typically maps to a Unix process. For example: "namenode-h1" and "datanode-h1".
- role group - A set of configuration properties for a set of role instances.
- host template - A set of role groups. When a template is applied to a host, a role instance from each role group is created and assigned to that host.
- gateway - A role that designates a host that should receive a client configuration for a service when the host does not have any role instances for that service running on it.
- parcel - A binary distribution format that contains compiled code and meta-information such as a package description, version, and dependencies.
 Note
NoteCluster Example
Consider a cluster Cluster 1 with four hosts as shown in the following listing from Cloudera Manager:
The host tcdn5-1 is the "master" host for the cluster, so it has many more role instances, 21, compared with the 6 role instances running on the other hosts. In addition to the CDH "master" role instances, tcdn5-1 also has Cloudera Management Service roles: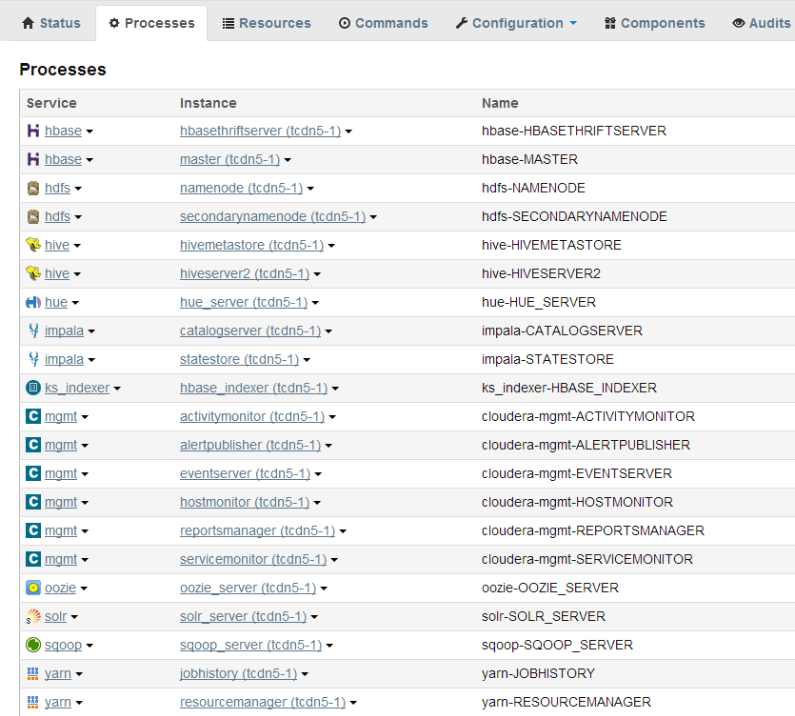
Architecture
As depicted below, the heart of Cloudera Manager is the Cloudera Manager Server. The Server hosts the Admin Console Web Server and the application logic. It is responsible for installing software, configuring, starting, and stopping services, and managing the cluster on which the services run.
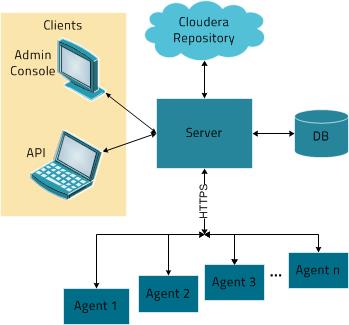
The Cloudera Manager Server works with several other components:
- Agent - installed on every host. It is responsible for starting and stopping processes, unpacking configurations, triggering installations, and monitoring the host.
- Database - stores configuration and monitoring information. There are typically multiple logical databases running across one or more database servers. For example, the Cloudera Manager Server and the monitoring daemons use different logical databases.
- Cloudera Repository - repository of software for distribution by Cloudera Manager.
- Clients - are the interfaces for interacting with the server:
- Admin Console - Web-based UI with which administrators manage clusters and Cloudera Manager.
- API - API with which developers create custom Cloudera Manager applications.
Heartbeating
Heartbeats are a primary communication mechanism in Cloudera Manager. By default the Agents send heartbeats every 15 seconds to the Cloudera Manager Server. However, to reduce user latency the frequency is increased when state is changing.
During the heartbeat exchange the Agent notifies the Cloudera Manager Server the actions it is performing. In turn the Cloudera Manager Server responds with the actions the Agent should be performing. Both the Agent and the Cloudera Manager Server end up doing some reconciliation. For example, if you start a service, the Agent attempts to start the relevant processes; if a process fails to start, the server marks the start command as having failed.
State Management
The Cloudera Manager Server maintains the state of the cluster. This state can be divided into two categories: "model" and "runtime", both of which are stored in the Cloudera Manager Server database.
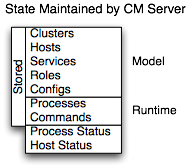
Cloudera Manager models CDH and managed services: their roles, configurations, and inter-dependencies. Model state captures what is supposed to run where, and with what configurations. For example, model state captures the fact that a cluster contains 17 hosts, each of which is supposed to run a DataNode. You interact with the model through the Cloudera Manager Admin Console configuration screens and API and operations such as "Add Service".
Runtime state is what processes are running where, and what commands (for example, rebalance HDFS or execute a Backup/Disaster Recovery schedule or rolling restart or stop) are currently being executed. The runtime state includes the exact configuration files needed to run a process. When you press "Start" in Cloudera Manager Admin Console, the server gathers up all the configuration for the relevant services and roles, validates it, generates the configuration files, and stores them in the database.
When you update a configuration (for example, the Hue Server web port), you've updated the model state. However, if Hue is running while you do this, it's still using the old port. When this kind of mismatch occurs, the role is marked as having an "outdated configuration". To resynchronize, you restart the role (which triggers the configuration re-generation and process restart).
While Cloudera Manager models all of the reasonable configurations, inevitably there are some cases that require special handling. To allow you to workaround, for example, a bug or to explore unsupported options, Cloudera Manager supports an "advanced configuration snippet" mechanism that lets you add properties directly to the configuration files.
Configuration Management
- The service level may define configurations that apply to the entire service instance, such as an HDFS service's default replication factor (dfs.replication).
- The role group level may define configurations that apply to the member roles, such as the DataNodes' handler count (dfs.datanode.handler.count). This can be set differently for different groups of DataNodes. For example, DataNodes running on more capable hardware may have more handlers.
- The role instance level may override configurations that it inherits from its role group. This should be used sparingly, because it easily leads to configuration divergence within the role group. One example usage is to temporarily enable debug logging in a specific role instance to troubleshoot an issue.
- Hosts have configurations related to monitoring, software management, and resource management.
- Cloudera Manager itself has configurations related to its own administrative operations.
Role Groups
It is possible to set configuration at the service instance (for example, "hdfs") or role instance (for example, the DataNode on host17). An individual role inherits the configurations set at the service level. Configurations made at the role level override those inherited from the service level. While this approach offers flexibility, it is tedious to configure a set of role instances in the same way.
Cloudera Manager supports role groups, a mechanism for assigning configurations to a group of role instances. The members of those groups then inherit those configurations. For example, in a cluster with heterogeneous hardware, a DataNode role group can be created for each host type and the DataNodes running on those hosts can be assigned to their corresponding role group. That makes it possible to set the configuration for all the DataNodes running on the same hardware by modifying the configuration of one role group. The "hdfs" service discussed earlier has the following role groups defined for the service's roles:

In addition to making it easy to manage the configuration of subsets of roles, role groups also make it possible to maintain different configurations for experimentation or managing shared clusters for different users and/or workloads.
Host Templates
- Adding new hosts to clusters easily - multiple hosts can have roles from different services created, configured, and started in a single operation.
- Altering the configuration of roles from different services on a set of hosts easily - which is useful for quickly switching the configuration of an entire cluster to accommodate different workloads or users.
Server and Client Configuration
Administrators are sometimes surprised that modifying /etc/hadoop/conf and then restarting HDFS has no effect. That is because service instances started by Cloudera Manager do not read configurations from the default locations. To use HDFS as an example, when not managed by Cloudera Manager, there would usually be one HDFS configuration per host, located at /etc/hadoop/conf/hdfs-site.xml. Server-side daemons and clients running on the same host would all use that same configuration.
Cloudera Manager distinguishes between server and client configuration. In the case of HDFS, the file /etc/hadoop/conf/hdfs-site.xml contains only configuration relevant to an HDFS client. That is, by default, if you run a program that needs to communicate with Hadoop, it will get the addresses of the NameNode and JobTracker, and other important configurations, from that directory. A similar approach is taken for /etc/hbase/conf and /etc/hive/conf.
$ tree -a /var/run/cloudera-scm-Agent/process/879-hdfs-NAMENODE/
  /var/run/cloudera-scm-Agent/process/879-hdfs-NAMENODE/
  ├── cloudera_manager_Agent_fencer.py
  ├── cloudera_manager_Agent_fencer_secret_key.txt
  ├── cloudera-monitor.properties
  ├── core-site.xml
  ├── dfs_hosts_allow.txt
  ├── dfs_hosts_exclude.txt
  ├── event-filter-rules.json
  ├── hadoop-metrics2.properties
  ├── hdfs.keytab
  ├── hdfs-site.xml
  ├── log4j.properties
  ├── logs
  │   ├── stderr.log
  │   └── stdout.log
  ├── topology.map
  └── topology.py
- Sensitive information in the server-side configuration, such as the password for the Hive metastore RDBMS, is not exposed to the clients.
- A service that depends on another service may deploy with customized configuration. For example, to get good HDFS read performance, Cloudera Impala needs a specialized version of the HDFS client configuration, which may be harmful to a generic client. This is achieved by separating the HDFS configuration for the Impala daemons (stored in the per-process directory mentioned above) from that of the generic client (/etc/hadoop/conf).
- Client configuration files are much smaller and more readable. This also avoids confusing non-administrator Hadoop users with irrelevant server-side properties.
Deploying Client Configurations and Gateways
A client configuration is a ZIP file that contain the relevant configuration files with the settings for a service. Each zip file contains the set of configuration files needed by the service. For example, the MapReduce client configuration zip file contains copies of core-site.xml, hadoop-env.sh, hdfs-site.xml, log4j.properties, and mapred-site.xml. Cloudera Manager supports a "Download Client Configuration" action to enable distributing the client configuration file to users outside the cluster.
Cloudera Manager can deploy client configurations within the cluster; each applicable service has a "Deploy Client Configuration" action. This action does not necessarily deploy the client configuration to the entire cluster; it only deploys the client configuration to all the hosts that this service has been assigned to. For example, suppose a cluster has 10 hosts, and a MapReduce service is running on hosts 1-9. When you use Cloudera Manager to deploy the MapReduce client configuration, host 10 will not get a client configuration, because the MapReduce service has no role assigned to it. This design is intentional to avoid deploying conflicting client configurations from multiple services.
To deploy a client configuration to a host that does not have a role assigned to it you use a gateway. A gateway is a marker to convey that a service should be accessible from a particular host. Unlike all other roles it has no associated process. In the preceding example, to deploy the MapReduce client configuration to host 10, you assign a MapReduce gateway role to that host.
Gateways can also be used to customize client configurations for some hosts. Gateways can be placed in role groups and those groups can be configured differently. However, unlike role instances, there is no way to override configurations for gateway instances.
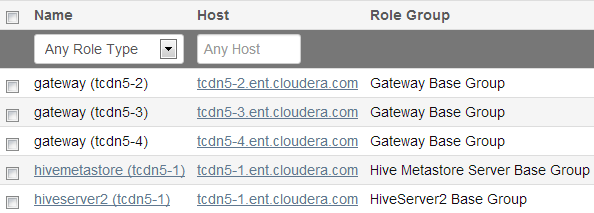
In the cluster we discussed earlier, the three hosts (tcdn5-[2-5]) that do not have Hive role instances have Hive gateways:
Process Management
In a non-Cloudera Manager managed cluster, you most likely start a role instance using an init script, for example, service hadoop-hdfs-datanode start. Cloudera Manager does not use init scripts for the daemons it manages; in a Cloudera Manager managed cluster, starting and stopping services using init scripts will not work.
In a Cloudera Manager managed cluster you can only start or stop services via Cloudera Manager. Cloudera Manager uses an open source process management tool called supervisord, which takes care of redirecting log files, notifying of process failure, setting the effective user ID of the calling process to the right user, and so on. Cloudera Manager supports automatically restarting a crashed process. It will also flag a role instance with a bad state if it crashes repeatedly right after start up.
It is worth noting that stopping Cloudera Manager and the Cloudera Manager Agents will not bring down your cluster; any running instances will keep running.
One of the Agent's main responsibilities is to start and stop processes. When the Agent detects a new process from the heartbeat, the Agent creates a directory for it in /var/run/cloudera-scm-agent and unpacks the configuration. These actions reflect an important point: a Cloudera Manager process never travels alone. In other words, a process is more than just the arguments to exec()—it also includes configuration files, directories that need to be created, and other information.
The Agent itself is started by init.d at start-up. It, in turn, contacts the server and figures out what processes should be running. The Agent is monitored as part of Cloudera Manager's host monitoring: if the Agent stops heartbeating, the host will be marked as having bad health.
Software Distribution Management
A major function of Cloudera Manager is to distribute and activate software in your cluster. Cloudera Manager supports two software distribution formats: packages and parcels.
A package is a binary distribution format that contains compiled code and meta-information such as a package description, version, and dependencies. Package management systems evaluate this meta-information to allow package searches, perform upgrades to a newer version, and ensure that all dependencies of a package are fulfilled. Cloudera Manager uses the native "system package manager" for each supported OS.
- Parcels are self-contained and installed in a versioned directory. This means that multiple versions of a given parcel can be installed side-by-side. You can then designate one of these installed versions as the active one. With traditional packages, only one package can be installed at a time so there's no distinction between what's installed and what's active.
- Parcels can be installed at any location in the filesystem. By default, parcels are installed in /opt/cloudera/parcels.
- CDH is distributed as a single object - In contrast to having a separate package for each part of CDH, when using parcels there is just a single object to install. This is especially useful when managing a cluster that isn't connected to the Internet.
- Internal consistency - All CDH components are matched so there isn't a danger of different parts coming from different versions of CDH.
- Installation outside of /usr - In some environments, Hadoop administrators do not have privileges to install system packages. In the past, these administrators had to fall back to CDH tarballs, which deprived them of a lot of infrastructure that packages provide. With parcels, administrators can install to /opt or anywhere else without having to step through all the additional manual steps of regular tarballs.
 Note
Note: With parcel software distribution, the path to the CDH libraries is /opt/cloudera/parcels/CDH/lib instead of the usual /usr/lib. - Installation of CDH without sudo - Parcel installation is handled by the Cloudera Manager Agent running as root so it's possible to install CDH without needing sudo.
- Decouples distribution from activation - Due to side-by-side install capabilities, it is possible to stage a new version of CDH across the cluster in advance of switching over to it. This allows the longest running part of an upgrade to be done ahead of time without affecting cluster operations, consequently reducing the downtime associated with upgrade.
- Rolling upgrades - These are only possible with parcels, due to their side-by-side nature. Traditional packages require shutting down the old process, upgrading the package, and then starting the new process. This can be hard to recover from in the event of errors and requires extensive integration with the package management system to function seamlessly. With the new version staged side-by-side, switching to a new minor version is simply a matter of changing which version of CDH is used when restarting each process. It then becomes practical to do upgrades with rolling restarts, where service roles are restarted in the right order to switch over to the new version with minimal service interruption. Note that major version upgrades (for example, CDH 4 to CDH 5) require full service restarts due to the substantial changes between the versions.
- Upgrade management - Cloudera Manager can fully manage all the steps involved in a CDH version upgrade. In contrast, with packages, Cloudera Manager can only help with initial installation.
- Distributing additional components - Parcels are not limited to CDH. Cloudera Impala, Cloudera Search, LZO, and add-on service parcels are also available.
- Compatibility with other distribution tools - If there are specific reasons to use other tools for download and/or distribution, you can do so, and Cloudera Manager will work alongside your other tools. For example, you can handle distribution with Puppet. Or, you can download the parcel to Cloudera Manager Server manually (perhaps because your cluster has no Internet connectivity) and then have Cloudera Manager distribute the parcel to the cluster.
Host Management
Cloudera Manager provides several features to manage the hosts in your Hadoop clusters. The first time you run Cloudera Manager Admin Console you can search for hosts to add to the cluster and once the hosts are selected you can map the assignment of CDH roles to hosts. Cloudera Manager automatically deploys all software required to participate as a managed host in a cluster: JDK, Cloudera Manager Agent, CDH, Impala, Solr, and so on to the hosts.
Once the services are deployed and running, the Hosts area within the Admin Console shows the overall status of the managed hosts in your cluster. The information provided includes the version of CDH running on the host, the cluster to which the host belongs, and the number of roles running on the host. Cloudera Manager provides operations to manage the life cycle of the participating hosts and to add and delete hosts. The Cloudera Management Service Host Monitor role performs health tests and collects host metrics to allow you to monitor the health and performance of the hosts.
Resource Management
- Guarantee completion in a reasonable time frame for critical workloads
- Support reasonable cluster scheduling between groups of users based on fair allocation of resources per group
- Prevent users from depriving other users access to the cluster
Cloudera Manager provides several features to assist you with allocating cluster resources to services. Initially Cloudera Manager introduced the ability to partition resources across HBase, HDFS, Impala, MapReduce, and YARN services by setting configuration properties that were enforced by Linux control groups (Linux cgroups). With Cloudera Manager 5, the ability to statically allocate resources using cgroups is configurable through a single static service pool user interface.
Static service pools isolate the services in your cluster from one another, so that load on one service has a bounded impact on other services. Services are allocated a static percentage of total resources—CPU, memory, and I/O weight—which are not shared with other services. When you configure static service pools, Cloudera Manager computes recommended memory, CPU, and I/O configurations for the worker roles of the services that correspond to the percentage assigned to each service. Static service pools are implemented per role group within a cluster, using Linux control groups (cgroups) and cooperative memory limits (for example, Java maximum heap sizes). Static service pools can be used to control access to resources by HBase, HDFS, Impala, MapReduce, Solr, Spark, YARN, and add-on services. Static service pools are not enabled by default.
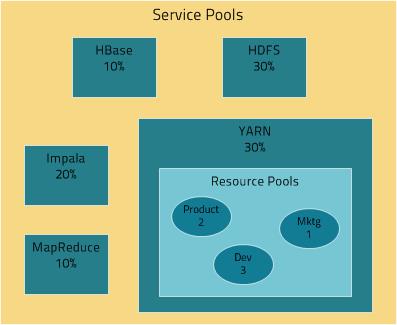
The following figure illustrates static pools for HBase, HDFS, Impala, MapReduce, and YARN services that are respectively assigned 10%, 30%, 20%, 10%, and 30% of cluster resources. In addition, three resource pools - Dev, Product, and Mktg with weights 3, 2, and 1 respectively - are defined for YARN. If an application starts and is assigned to the Product pool, and other applications are using the Dev and Mktg pools, the Product resource pool will receive 30% x 2/6 (or 10%) of the total cluster resources. If there are no applications using the Dev and Mktg pools, the YARN Product pool will be allocated 30% of the cluster resources.
- (CDH 5) YARN Independent RM - YARN manages the virtual cores, memory, running applications, and scheduling policy for each pool.
- (CDH 5) YARN and Impala Integrated RM - YARN manages memory for pools running Impala queries; Impala limits the number of running and queued queries in each pool.
- (CDH 5) YARN and Impala Independent RM - YARN manages the virtual cores, memory, running applications, and scheduling policy for each pool; Impala manages memory for pools running queries and limits the number of running and queued queries in each pool.
- (CDH 5 and CDH 4) Impala Independent RM - Impala manages memory for pools running queries and limits the number of running and queued queries in each pool.
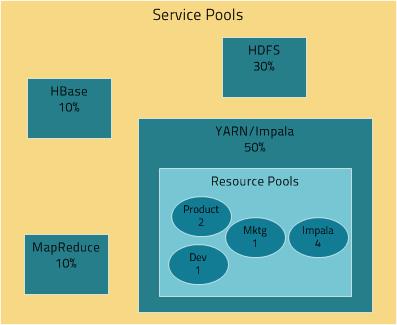
In the YARN and Impala integrated RM scenario, Impala services can also reserve resources through YARN, effectively sharing the static YARN service pool and resource pools with YARN applications. In the following figure, the YARN and Impala services have a 50% static share which is subdivided among the original resource pools with an additional resource pool designated for the Impala service. If YARN applications are using all the original pools, and Impala uses its designated resource pool, Impala queries will have the same resource allocation 50% x 4/8 = 25% as in the first scenario. However, when YARN applications are not using the original pools, Impala queries will have access to 50% of the cluster resources.
User Management
Access to Cloudera Manager features is controlled by user accounts. A user account identifies how a user is authenticated and determines what privileges are granted to the user.
User authentication can be done through a local database, through an external LDAP directory server (Active Directory or OpenLDAP-compatible), SAML, or through an external authentication program of your own choosing.
- Administrator - Allows the user to add, change, delete, and configure services or administer user accounts. Also, even if you are using an external authentication mechanism for user authentication, users with Administrator privileges can log in to Cloudera Manager using their local Cloudera Manager username and password. (This prevents the system from locking everyone out if the external authentication settings get misconfigured.)
- Limited Administrator - Allows the user to view service and monitoring information and decommission hosts, but cannot add services or take any other actions that affect the state of the cluster.
- Read-Only - Allows the user to view service and monitoring information but cannot add services or take any actions that affect the state of the cluster.
Cloudera Management Service
- Activity Monitor - collects information about activities run by the MapReduce service
- Host Monitor - collects health and metric information about hosts
- Service Monitor - collects health and metric information about services and activity information from the YARN and Impala services
- Event Server - aggregates relevant Hadoop events and makes them available for alerting and searching
- Alert Publisher - generates and delivers alerts for certain types of events
- Reports Manager - generates reports that provide an historical view into disk utilization by user, user group, and directory, processing activities by user and YARN pool, and HBase tables and namespaces.
Health Tests
Cloudera Manager monitors the health of the services, roles, and hosts that are running in your clusters via health tests. The Cloudera Management Service also provide health tests for its roles. Role-based health tests are enabled by default. For example, a simple health test is whether there's enough disk space in every NameNode data directory. A more complicated health test may evaluate when the last checkpoint for HDFS was compared to a threshold or whether a DataNode is connected to a NameNode. Some of these health tests also aggregate other health tests: in a distributed system like HDFS, it's normal to have a few DataNodes down (assuming you've got dozens of hosts), so we allow for setting thresholds on what percentage of hosts should color the entire service down.
Health tests can return one of three values: Good, Concerning, and Bad. A test returns Concerning health if the test falls below a warning threshold. A test returns Bad if the test falls below a critical threshold. The overall health of a service or role instance is a roll-up of its health checks. If any health test is Concerning (but none are Bad) the role's or service's health is Concerning; if any health test is Bad, the service's or role's health is Bad.
In the Cloudera Manager Admin Console, health tests results are indicated with colors: Good , Concerning
 , and Bad
 .
.
One common question is whether monitoring can be separated from configuration. One of the goals for monitoring is to enable it without needing to do additional configuration and installing additional tools (for example, Nagios). By having a deep model of the configuration, Cloudera Manager is able to know which directories to monitor, which ports to use, and what credentials to use for those ports. This tight coupling means that, when you install Cloudera Express all the monitoring is enabled.
Metric Collection and Display
To perform monitoring, the Service Monitor and Host Monitor collects metrics. A metric is a numeric value, associated with a name (for example, "CPU seconds"), an entity it applies to ("host17"), and a timestamp. Most metric collection is performed by the Agent. The Agent communicates with a supervised process, requests the metrics, and forwards them to the Service Monitor. In most cases, this is done once per minute.
A few special metrics are collected by the Service Monitor. For example, the Service Monitor hosts an HDFS canary, which tries to write, read, and delete a file from HDFS at regular intervals, and measure whether it succeeded, and how long it took. Once metrics are received, they're aggregated and stored.
Using the Charts page in the Cloudera Manager Admin Console, you can query and explore the metrics being collected. Charts display time series, which are streams of metric data points for a specific entity. Each metric data point contains a timestamp and the value of that metric at that timestamp.
Some metrics (for example, total_cpu_seconds) are counters, and the appropriate way to query them is to take their rate over time, which is why a lot of metrics queries contain the dt0 function. For example, dt0(total_cpu_seconds). (The dt0 syntax is intended to remind you of derivatives. The 0 indicates that the rate of a monotonically increasing counter should never have negative rates.)
Events, Alerts, and Triggers
An event is a record that something of interest has occurred – a service's health has changed state, a log message (of the appropriate severity) has been logged, and so on. Many events are enabled and configured by default.
An alert is an event that is considered especially noteworthy and is triggered by a selected event. Alerts are shown with an  badge when they appear in a list of events. You can configure the Alert Publisher to send alert notifications by email or via SNMP trap to a trap receiver such as HP OpenView.
A trigger is a statement that specifies an action to be taken when one or more specified conditions are met for a service, role, role configuration group, or host. The conditions are expressed as a tsquery, and the action to be taken is to change the health for the service, role, role configuration group, or host to either Concerning (yellow) or Bad (red).
| << Cloudera Manager Introduction | Cloudera Express and Cloudera Enterprise Features >> | |