
Cluster-wide metrics display information that represents your whole cluster. The Ambari Dashboard shows the following cluster-wide metrics:
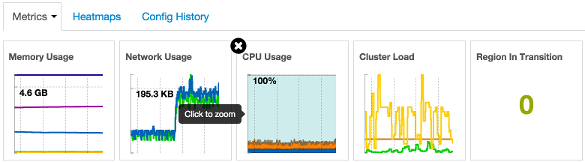
Ambari Cluster-Wide Metrics and Descriptions
|
Metric: |
Description: |
|---|---|
|
Memory Usage |
The cluster-wide memory utilization, including memory cached, swapped, used, shared. |
|
Network Usage |
The cluster-wide network utilization, including in-and-out. |
|
CPU Usage |
Cluster-wide CPU information, including system, user and wait IO. |
|
Cluster Load |
Cluster-wide Load information, including total number of nodes. total number of CPUs, number of running processes and 1-min Load. |
To remove a widget from the dashboard, click the white X.
Hover your cursor over each cluster-wide metric to magnify the chart or itemize the widget display.
To remove or add metric items from each cluster-wide metric widget, select the item on the widget legend.
To see a larger view of the chart, select the magnifying glass icon.
Ambari displays a larger version of the widget in a pop-out window, as shown in the following example:
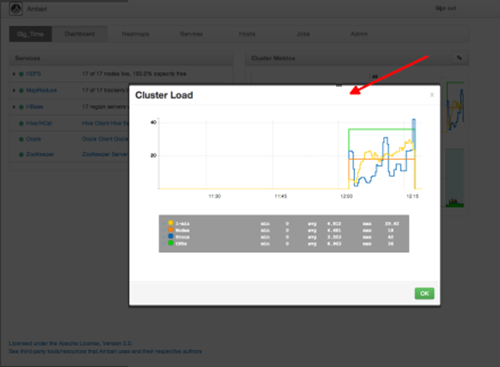
Use the pop-up window in the same ways that you use cluster-wide metric widgets on the dashboard.
To close the widget pop-up window, choose OK.
