Ambari Metrics System ("AMS") is a system for collecting, aggregating and serving Hadoop and system metrics in Ambari-managed clusters. AMS has three primary components: Metrics Collector, Metrics Monitors and Hadoop Sinks.
The Metrics Monitors are installed and run on each host in the cluster to collect system-level metrics and publish to the Metrics Collector.
The Hadoop Sinks plug into the various Hadoop components to publish Hadoop metrics to the Metrics Collector.
The Metrics Collector is a daemon that runs on a specific host in the cluster and receives data from the registered publishers, the Monitors and Sinks.
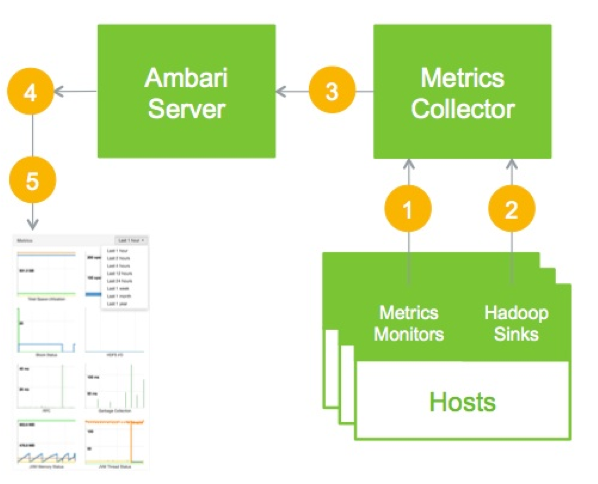
The following diagram provides a high-level illustration of how the components of AMS work together to collect metrics and make those metrics available to Ambari.

Metrics Monitors (on each host), send system-level metrics to Collector
Hadoop Sinks (on each host), send system-level metrics to Collector
Metrics Collector stores and aggregates metrics
Ambari exposes REST API for metrics retrieval
Ambari REST API feed Ambari Web UI
To get optimal performance from the Ambari Metrics System, you should review the following Collector configuration options and the General Guidelines.
| Option | Description |
|---|---|
| Collector Modes | The Collector can run in two modes: embedded mode and distributed mode. These modes impact where metrics data is stored and how the Collector process runs. See Collector Modes for more information. |
| Aggregated TTL Settings | The Time to Live settings for aggregated metrics. This impacts the amount of data that is stored and how long the data is retained. See Aggregated Metrics TTL for more information. |
| Memory Settings | Memory properties for the Collector components. These settings impact the overall performance of the Collector. See Memory Settings for more information. |

