Query Tab
Click the Query tab to browse database tables and columns and to build, execute, and debug queries.
Database Explorer
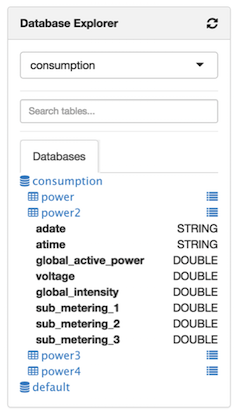
The Database Explorer enables you to view all databases and tables in Hive that you have permissions to view. It is designed to navigate a large number of databases, tables, and columns:
Features of Database Explorer:
Click the refresh icon in the top right to view tables that were created since the Hive View session began.
Select a database from the drop-down list. All queries in the current tab are then run against the selected database. You can also edit the drop-down list to enable substring searches over a large number of databases.
Use the Search tables and Search columns fields to search when you have a large number of tables and columns.
Browse the Databases tab to view all of the databases, tables, and columns. This is useful when you are authoring queries. The icon to the right of a table enables you to see sample data within that table.
Query Editor
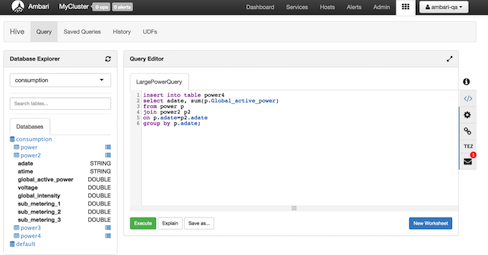
You can author and execute queries in the Query Editor:
Features and Behavior of Query Editor
All queries contained in a Worksheet tab execute sequentially, and they run in the same session. Running all queries in one pass requires handling the output of multiple select statements and is not supported in the 1.0 version.
To run a specific query, highlight it, and click Execute.
When the first query is executed in a Worksheet, a Tez session is opened.
Click Save as to save your query.
Double-click the Worksheet tab to rename the query, click OK, and then Save as to save the query with the new name.
Click New Worksheet to open a new worksheet tab. Queries executed from the new worksheet tab will execute in a different session. Queries from different worksheets can execute in parallel.
Press CTRL + space to autocomplete query statements.
Click the double arrow icon in the upper right corner of the Query Editor to expand the Worksheet area and cover Database Explorer. Click the icon again to collapse the Worksheet and make Database Explorer available again.
Click the icon at the bottom of the Worksheet window and drag it down to expand the authoring space.
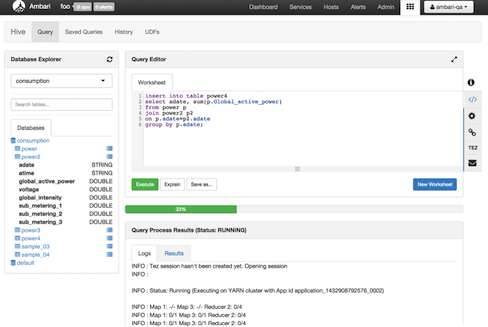
Query results and logs display below the query when it is executed.
Query Editor Settings
Click the gear icon on the right margin of the worksheet to access settings for the Query Editor. Then click Add, select a setting parameter from the drop-down list, and then select a value for the parameter. Query Editor settings are configured per worksheet.
To save settings as default settings so they are applied each time that a new worksheet is opened, click Save Default Settings in the upper right corner of the settings window.
Click SQL to the right of the Worksheet window to exit settings and return to the Query Editor authoring pane.
Text Explain and Visual Explain
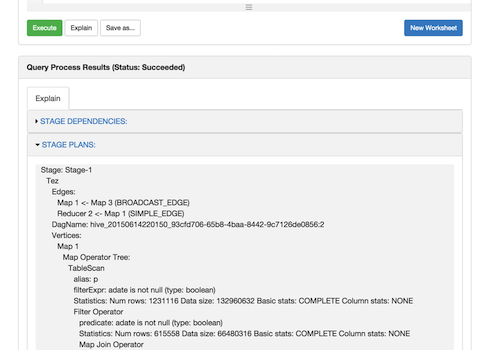
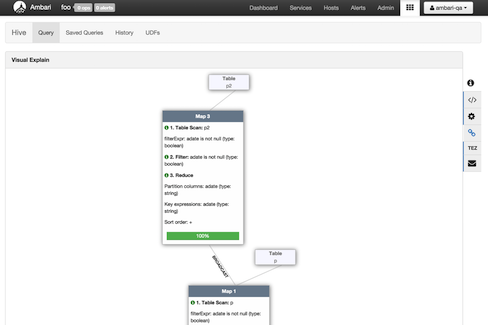
There are two options that help you understand how your queries are executed. One is a textual explanation of your query and the other form explains the query visually as a diagram. In future releases, column lineage will be added.
The Explain button in the lower left corner of the Worksheet window launches a textual explanation:
To launch the Visual Explain diagram, click the link icon to the right of the Worksheet window. If the query is running, Visual Explain shows the query execution progress per vertex:
Using the Tez View to Debug Query Execution
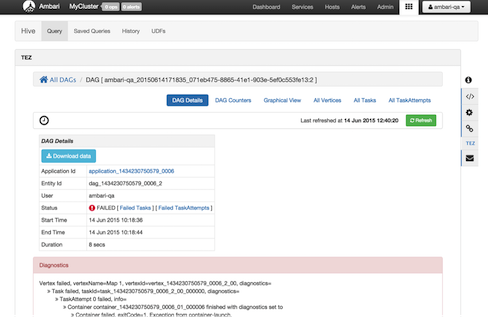
Query execution can be debugged using the embedded Tez view. To access the Tez view, click TEZ in the toolbar on the right of the Worksheet window:
When a query fails, the Status field displays FAILED and there is a link to Failed Tasks and the error displays on the first page. Click Download data to get the data for the task. For further details on debugging, see the Tez View.
Errors and Alerts
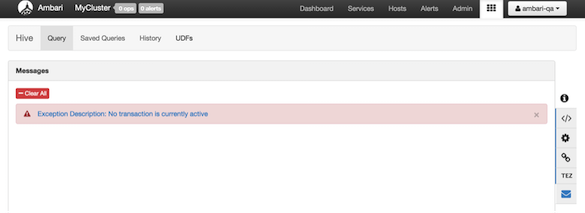
Errors and alerts can be viewed by clicking the envelope icon in the toolbar to the right of the Worksheet window. When the icon is clicked, all the messages are shown with a one-line summary per message:
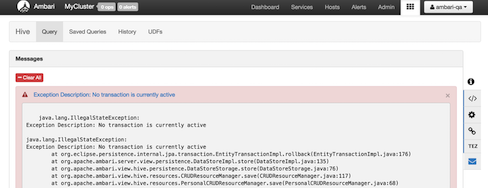
If you want to view details of the errors, expand the summary by clicking it. The details text can be copied into a bug report:


