

Viewing the DAG flow
The DAG Flow tab displays the Directed Acyclic Graph that is created by the Hive engine in the form of a flowchart.
The following image shows the DAG flow in the form of a flowchart:
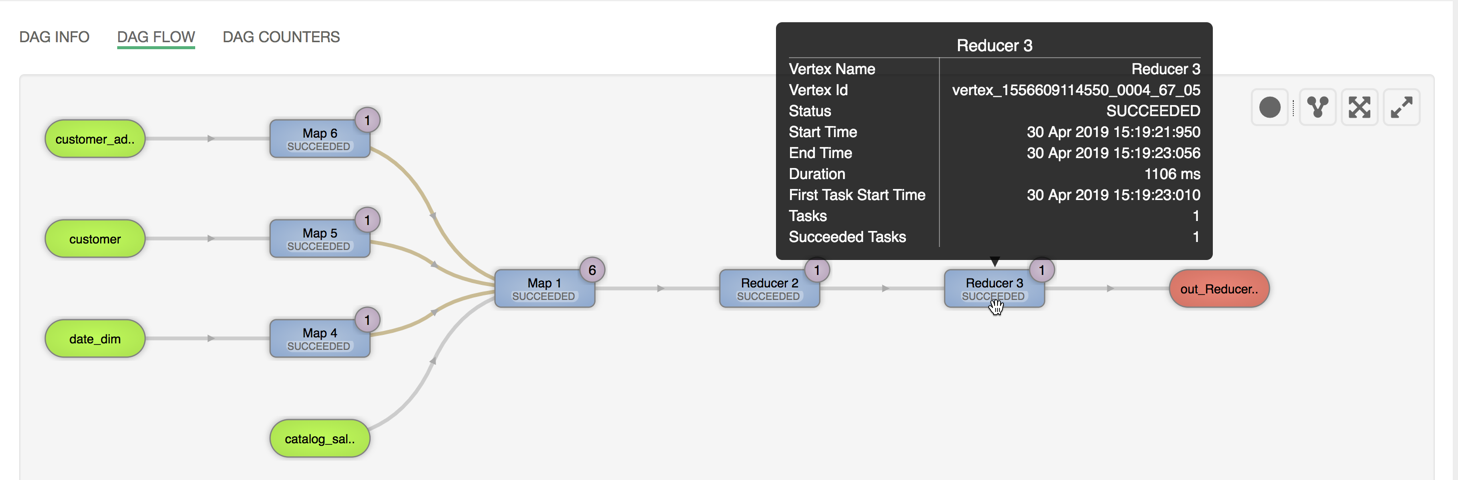
Here, the inputs to vertices Map 4, Map 5, Map 6, and Map 1 are the tables displayed in green boxes. Next, Map 1 depends on the result set generated by Map 4, Map 5, and Map 6. Map 1 then passes its result as an input to Reducer 2. When the Reducer 2 finishes its execution, the results are passed on to Reducer 3. Reducer 3 is the last vertex in the DAG flow. After the Reducer 3 successfully completes its execution, the query output is written to a file in HDFS.
There are a few options to change the layout of the DAG flow. You can hide the input and the output nodes to view only the task vertices by clicking the Toggle source/sink visibility icon. You can switch between the horizontal and vertical orientation by clicking the Toggle orientation icon.